Aguila
- The text on this page is taken from an equivalent page of the IEHIAS-project.
Aguila is an exploratory data analysis tool. It is capable of visualising various types of data in different ways and it maintains interactive links between these visualisations.
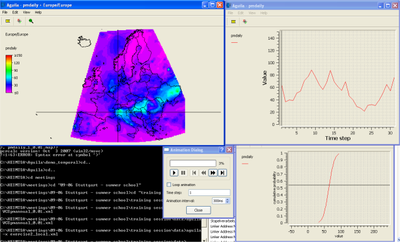
As an example, you can visualise a spatio-temporal attribute using a map view and a time series view. Aguila allows you to explore the temporal variation of each location on the map by clicking in the map view. This also works the other way around. You can explore the spatial distribution of each moment in time by clicking in the time series view.
Beside spatio-temporal variation, Aguila has support for scenarios (AKA alternatives) and uncertainty.
In short, Aguila:
- can visualise various types of data,
- can read many data set formats,
- runs at least on the major operating systems,
- is licensed under the GPL.
For further information see PPCRaster.
Contents
Model description
Purpose
Aguila is an interactive data visualisation tool for spatio-temporal information. The aim is to provide tools for exploration of the structure, characteristics and uncertainties of the input data.
Boundaries
Field(s) of model:
e.g. Outdoor Air, Indoor Air, Water, Soil, Noise, Exposure, Multimedia, Drinking water
Spatial coverage, Spatial resolution, Temporal coverage and Temporal resolution depend on the input data.
Input
Any type of spatially referenced measured or modelled data, e.g. pollutants, stressors, health effects can be visualised as long as it comes as a vector or raster data format. Raster data is supported by the geospatial data abstraction library. Support of vector data is under development and comprises currently ESRI shapefiles with an external attribute database file. For uncertainty, time and scenario view, naming conventions are developed for the files. Scenarios are ordered in folders, the raster files are named with the attribute they contain and timestep as well as quantile of the probability distribution if available. Currently, Aguila only reads quantiles of a cumulative probability distribution and interpolates the pdf from the quantile files. An example is shown below:
folders (scenarios):
A2, A1B, B1
files within folders (attribute_timestep_quantile):
PM10_2005_0.01
PM10_2005_0.05
PM10_2005_0.1
PM10_2005_0.25
PM10_2005_0.5
PM10_2005_0.75
PM10_2005_0.9
PM10_2005_0.95
PM10_2005_0.99
PM10_2010_0.01
Output
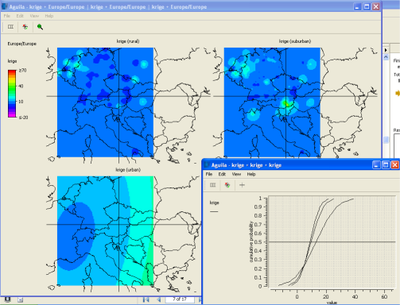
Visual output in an interactive graphical user interface. Aguila can visualise time, attribute uncertainty as a probability distribution and scenarios in different, interconnected windows.
Probability view and time series:
Scenario view:
Description of processes modelled and of technical details
Aguila stores the uncertainties as probability distribution for each raster cell. The user can explore the uncertainties by moving through the raster map through the probability distribution. Time is shown as timeline and can be visualised by animation. Scenarios are displayed as maps next to each other showing the same spatial area with different raster results.
Aguila is part of the PCRaster Open Source tools and is licensed und GPL. Installation packages can be downloaded for Windows and Linux here
Aguila was developed by the University of Utrecht, Netherlands. For further information see: PCRaster.
Rationale
Aguila is a helpful tool to visualise outputs of each step in the full chain. The ability to visualise uncertainties as well as compare scenarios helps to gain a better insight in the data output than simple plain visualisation without taking probability and scenario differences into account.


