File:Decision diagram.png
From Opasnet

No higher resolution available.
Decision_diagram.png (751 × 341 pixels, file size: 18 KB, MIME type: image/png)
A decision diagram represents a complex multi-decision, multi-stakeholder decision situation. The main parts and their relations are shown according to the open assessment method. D = decisions, C = causal nodes, O = outcomes of interest, S = stakeholders, V = valuations, i.e. preferences by the stakeholders about the outcomes. It is noteworthy that in this case, the decision maker of D2 cannot influence outcome O2 even if she has preferences between different realisations. The method can assess such situations and their impacts on what can be seen as good for the society at large.
Original file in Google Docs.
File history
Click on a date/time to view the file as it appeared at that time.
| Date/Time | Thumbnail | Dimensions | User | Comment | |
|---|---|---|---|---|---|
| current | 17:50, 19 September 2013 | | 751 × 341 (18 KB) | Jouni (talk | contribs) | Replaced actors A with stakeholders S |
| 06:13, 17 September 2013 | 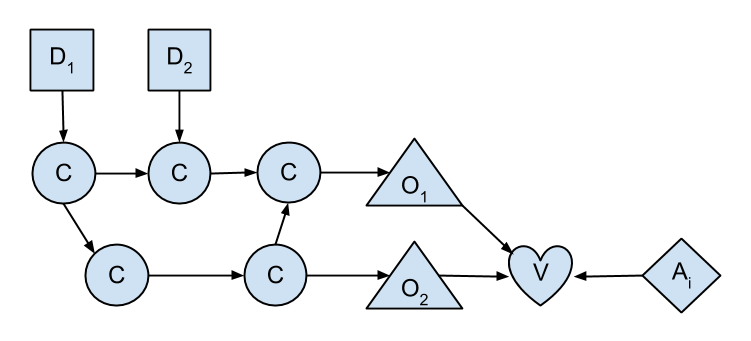 | 751 × 341 (18 KB) | Jouni (talk | contribs) | Category:Open assessment '''Decision diagram''' is an overall representation of a complex multi-decision, multi-stakeholder decision situation. The diagram shows the major parts and their relations. |
- You cannot overwrite this file.
File usage
The following page links to this file:
