State of the art in benefit–risk analysis: Economics and Marketing-Finance
This page is a nugget.
The page identifier is Op_en5537 | |
|---|---|
| Moderator:Essi Vuorinen (see all) | |
|
| |
| Upload data
|
Unlike most other pages in Opasnet, the nuggets have predetermined authors, and you cannot freely edit the contents. Note! If you want to protect the nugget you've created from unauthorized editing click here |
This page (including the files available for download at the bottom of this page) contains a draft version of a manuscript, whose final version is published and is available in the Food and Chemical Toxicology 50 (2012) 56–66. If referring to this text in scientific or other official papers, please refer to the published final version as: N. Kalogeras, G. Odekerken-Schröder, J.M.E. Pennings, H. Gunnlaugsdottir, F. Holm, O. Leino, J.M. Luteijn, S.H. Magnússon, M.V. Pohjola, M.J. Tijhuis, J.T. Tuomisto, Ø. Ueland, B.C. White, H. Verhagen: State of the art in benefit–risk analysis: Economics and Marketing-Finance. Food and Chemical Toxicology 50 (2012) 56–66 doi:10.1016/j.fct.2011.07.066 .
Contents
Title
State of the art in benefit–risk analysis: Economics and Marketing-Finance
Authors and contact information
- N. Kalogeras, corresponding author
- (Maastricht University, School of Business and Economics, The Netherlands, N.Kalogeras@maastrichtuniversity.nl, Tel.: +31 43 388 4827, fax: +31 43 388 4875.)
- G. Odekerken-Schröder
- (Maastricht University, School of Business and Economics, The Netherlands)
- J.M.E. Pennings
- (Maastricht University, School of Business and Economics, The Netherlands)
- H. Gunnlaugsdόttir
- (Matís, Icelandic Food and Biotech R&D, Iceland)
- F. Holm
- (FoodGroup Denmark & Nordic NutriScience, Denmark)
- O. Leino
- (National Institute for Health and Welfare, Finland)
- J.M. Luteijn
- (University of Ulster, School of Nursing, United Kindom)
- S.H. Magnússon
- (Matís, Icelandic Food and Biotech R&D, Iceland)
- M.V. Pohjola
- (National Institute for Health and Welfare, Finland)
- M.J. Tijhuis
- (Maastricht University, School of Business and Economics, The Netherlands)
- (National Institute for Public Health and the Environment, The Netherlands)
- J.T. Tuomisto
- (National Institute for Health and Welfare, Finland)
- Ø. Ueland
- (Nofima, Norway)
- B.C. White
- (University of Ulster, Department of Pharmacy & Pharmaceutical Sciences, School of Biomedical Sciences, Northen Ireland, United Kindom)
- H. Verhagen
- (National Institute for Public Health and the Environment, The Netherlands)
- (Maastricht University, NUTRIM School for Nutrition, Toxicology and Metabolism, The Netherlands)
- (University of Ulster, Northern Ireland Centre for Food and Health, Northern Ireland, United Kindom)
Article info
Available online 18 August 2011
Abstract
All market participants (e.g., investors, producers, consumers) accept a certain level of risk as necessary to achieve certain benefits. There are many types of risk including price, production, financial, institutional, and individual human risks. All these risks should be effectively managed in order to derive the utmost of benefits and avoid disruption and/or catastrophic economic consequences for the food industry. The iden- tification, analysis, determination, and understanding of the benefit–risk trade-offs of market participants in the food markets may help policy makers, financial analysts and marketers to make well-informed and effective corporate investment strategies in order to deal with highly uncertain and risky situations. In this paper, we discuss the role that benefits and risks play in the formation of the decision-making pro- cess of market-participants, who are engaged in the upstream and downstream stages of the food supply chain. In addition, we review the most common approaches (expected utility model and psychometrics) for measuring benefit–risk trade-offs in the economics and marketing-finance literature, and different fac- tors that may affect the economic behaviour in the light of benefit–risk analyses.
Building on the findings of our review, we introduce a conceptual framework to study the benefit–risk behaviour of market participants. Specifically, we suggest the decoupling of benefits and risks into the sep- arate components of utilitarian benefits, hedonic benefits, and risk attitude and risk perception, respec- tively. Predicting and explaining how market participants in the food industry form their overall attitude in light of benefit–risk trade-offs may be critical for policy-makers and managers who need to understand the drivers of the economic behaviour of market participants with respect to production, marketing and consumption of food products.
Abbreviations
GM, genetically modified; u(x), utility function; SE, bovine spongiform encephalopathy; SMEs, small medium enterprises; EU, expected utility; CE, certainty equivalence; MD, mean-standard deviation model; IP, ideal-point model; WT, willingness to trade-off; X, uncertain option; R, perceived risk; EWT, extended willingness to trade-off; V(X), subjective expected value; w(x), weighting function; x,z, outcome(s); p, probability; CBR, consumer benefit–risk behaviour; RA, risk attitude; RP, risk perception; UB, utilitarian benefits; HB, hedonic benefits.
Keywords
Benefit–risk trade-offs, Decoupling, Utility, Economics, Marketing-Finance
Introduction
The food industry as a whole is undergoing structural changes in terms of internalisation, concentration and network relationships (Zylbersztajn and Omta, 2009; Baourakis et al., 2011). The successive and intensive liberalisation of markets forces the foodindustry to respond to rapid and radical changes in the marketplace through globalisation and large-scale operations (King et al., 2010). Understanding economic behaviour (e.g., risk-returns and/or benefits-risks) at different stages (e.g., production, retailing, consumption) of the food supply chain is critical in formulating updated and well-informed public economic policies, corporate investment and marketing strategies (Meulenberg, 2000; Kalogeras, 2010).
Recent research in agribusiness economics, finance, and marketing has put the underlying decision-making process of market participants (e.g., investors, producers, consumers) in the spotlight (Kalogeras, 2010). For instance, to study the preferences and choices of end-users, consumers, in the food supply chain, it is important to understand how they evaluate derived benefits and potential risks associated with food consumption (Siergist, 2000; Costa-Font and Mossialos, 2007; Fischer and Frewer, 2009). Hence, attention is centred on the trade-offs between benefit and risk behaviour of market participants engaged in the food markets. The question that emerges is how one can evaluate the drivers of economic behaviour (e.g., preferences, decisions, choices) of market participants in light of benefit–risk analysis in the food domain. Failure to identify and evaluate the impact of benefits and risks on economic behaviour, as well as the impact of factors driving the benefit–risk trade-offs associated with investments in food production, processing, marketing, and consumption, may result in, for instance, a dramatic decrease in production and consumption of certain food products. This decrease, in turn, may have catastrophic economic consequences for the food industry and disrupt the economic relationships in the food markets and society as a whole (Pennings et al., 2002; Wansink, 2004; Cleeren et al., 2008; van Heerde et al., 2007).
In this paper, we review the business economics and marketing-finance literature regarding the drivers of benefits and risks of market participants engaged in the food industry. To address the subject matter of this review (benefit–risk analysis for foods), we aim to provide a new perspective based on lessons that could be learnt from business economics analysis. Throughout our review, we address issues related either to economic risks and benefits and their impact on the profitability of agribusinesses and consumption of food products, or to consumer health risks and benefits caused by the impact of different market forces on food supply chains. Although these two perspectives (economic and health-related risks and benefits) may be considered somehow different, benefit in one may pose a risk in the other. For instance, there are certain benefits for farmers when commodity prices increase, however this may pose a risk to consumers. That is, consumers who have certain income constraint may alter their purchasing habits. They may shift from buying nutritious food to less nutritious food and, in turn, they may face the consequences resulting from their poor diet choices.
The paper is structured as follows. We first discuss the role of risks and benefits and the impact that both concepts have on economic behaviour in different decision contexts related to agribusiness and food domains. Next, we briefly review the most common risk and benefit measures. Third, we introduce a conceptual framework of benefit–risk behaviour with respect to the food choice. We argue that by decoupling the benefit-risk behaviour of market participants into the separate components of risk attitude and risk perception and utilitarian and hedonic benefits, respectively, we may develop the basis of a generic conceptualisation that may allow better prediction of market participants’ behaviour in food markets. This, in turn, may provide answers as to how public policy-makers, industry managers and marketers in the food industry can deal with different segments of market-participants in highly uncertain and risky market environments (e.g., globalised product-harm crises). Moreover, knowing the drivers of benefit–risk trade-offs may provide insights into whether the solutions to market situations entailing high risk and uncertainty may rely on more drastic measures (e.g., elimination of the risk content) or investing in more effective communication strategies (e.g., retrieval and/or storage strategies).
Benefit–risk behaviour of market participants
Risk is a key component of economic behaviour. [1] All market participants accept a certain level of risk as necessary to achieve certain benefits (e.g., derive utility from their involvement in investment, production, or consumption activities). That is, a lot of theoretical and empirical work has been done in analysing decision-makers’ behaviour under risk. Particularly in (food) economics, finance and marketing-management literature, there is a wide variety of research propositions on how risk preferences influence market participants’ behaviour. The utility concept plays a crucial role in this literature. In the business economics literature, utility is derived from outcomes such as wealth, income, profit, selling price, among others. That is, the outcome domain is a monetary one. The utility function provides information about the utility that decision-makers derive from the different outcomes (e.g., wealth, income, profit, selling price). Yet, in behavioural economics, behavioural finance, marketing and consumer behaviour literature, market participants may derive utility from non-monetary outcomes by exposing a combination of cognitive and affective behaviour. We provide a selected review of empirical and theoretical research topics that have been addressed frequently in the business economics and marketing-finance literature regarding benefit–risk evaluations.[2] In particular, social environment’s structure, reputation, culture (e.g., initiatives we review the economic behaviour of market participants that stand at the upstream and downstream stages of the food supply chain: food producers and consumers.
The risk concept
The dominant paradigm in business economics, finance and marketing-management science is the expected utility model (Meyer, 2002). The expected utility model is concerned with choices among risky prospects whose outcomes may be either single or multidimensional (Schoemaker, 1982). The goal of a decision maker (e.g., farmer, consumer) is the maximisation of expected utility (EU). In the expected utility framework, the shape of the utility function is assumed to reflect a decision-maker’s risk preference (Pratt, 1964; Arrow, 1971). Therefore, the expected subjective utility function of any prospect reveals the individuals’ attitudes towards risk. There is a continuous stream of research on decision-makers’ risk preferences in the fields of food economics and marketing-finance (e.g., Anderson et al., 1977; Smidts, 1990; Just and Pope, 2002; Hardaker et al., 2004; Eeckhoudt et al., 2005; Pennings et al., 2002; Kalogeras, 2010). Most of that research uses objective or normative (i.e., assumption and establishment of norms implying the rationality principle in the economic behaviour of market-participants: maximisation of their utility) and subjective(i.e., relaxing the rationality assumptions inherent in the normative models) expected utility models as well as psychometric constructs, when analysing the risk behaviour of market participants. Several authors have shown that decision-makers can be simultaneously risk-seeking and risk-averse in different domains, implying that risk preference is context-specific (e.g., Payne et al., 1980; Smidts, 1997; Pennings and Smidts, 2000). Thus, we review, in brief, topics and approaches in business economics and marketing- finance literature related to the risk behaviour of market participants (i.e., producers and consumers) into specific decision contexts.
Producers’ risk behaviour
Operational risky decisions of producers (i.e., farmers) concerning the optimum level of pesticides, use of fertilisers and biological pest controls, are analysed in Carlson (1970, 1988), Moscardi and de Janvry (1977), and Thornton (1985). Although, many important benefits (e.g., a net benefit in terms of farmer’s income) are achieved by the use of agrochemicals, some of these studies indicate that the optimum level of use of pesticides and several fertilizers may entail a type of ‘‘multi-factorial’’ risk. That is, where some pesticide use may be beneficial in terms of crop yield and performance, it may result in substantial environmental damages (Wossink and Denaux, 2006). Further these studies seem to suggest that the aversion of farmers towards risk, which is explained by a set of socioeconomic variables, may be a critical factor for the determination of the use of pesticides or fertilisers during the production process. Examples of socioeconomic variables are farmer’s age, education, family structure (e.g. spouse farm or off-farm income), experience with farming, and the dynamics of a farmer’s social environment’s structure, reputation, culture (e.g., initiatives for participation in collective business schemes in a specific region, family or region’s tradition in farming).
Moreover, risk-attitude is frequently cited as a determinant for the adoption and utilisation of newtechnologies inday-to-day farmoperations (e.g., Feder et al., 1982).Huijsman(1986)analyseshowfarmers’ risk-aversion causes slow adoption of new technologies. Isik and Khanna (2003) examine the extent to which farmers’ risk aversion and uncertainties about production (e.g., soil fertility, weather) have an impact on their decisions to adopt site-specific technologies. Other studies (e.g., Just and Pope, 1978; Roosen and Henessy, 2003) have tried to identify the risk preferences of farmers using certain riskreducing inputs (e.g. conservation tillage for reducing soil erosion) during the life-cycle of a production phase. Empirical studies of the choice of farm cropping plans as a decision under risk have been conducted by, among others, Bousard and Petit (1967),Officer andHalter (1968), Scott and Baker (1972), Lin et al. (1974), Brink and McCarl (1978), and Lindner and Gibbs (1990). These studies explain the crop-related resource restrictions that farmers face and suggest that the choice of an optimal production level under these restrictions is, in most cases, influenced by farmers’ risk preferences.
In many countries farmers have the opportunity to reduce price risks, which affect their income by means of various financial and marketing arrangements. Various authors, amongst others Fransisco and Anderson (1972), Webster and Kennedy (1975), Dillon and Scandizzo (1978), Bond and Wonder (1980), Biswanger (1980), and Antwood and Bushema (2003), have conducted studies that deal directly with the attitudes of farmers towards income risk. These studies examine the effects of external environmental factors (e.g., policy changes, market volatility in periods of crisis), as well as farm-specific characteristics (e.g., debt-to-asset ratio, location of farm, size, composition of decision making unit), on producers’ risk behaviour. Studies by Martin and Hope (1984), Goodwin and Schroeder (1994), Collins (1997), Pennings and Meulenberg (1997), Pennings and Leuthold (2000), Pennings and Garcia (2001), Grimes and Meyers (2001), Bjornson and Carter (1997), and Roe et al. (2004), among others, show that risk attitude is the most important variable related to hedging behaviour, both from a theoretical and empirical point of view. There is a large body on hedging in financial and agricultural economics literature, assuming that farmers can reduce price risk by offsetting the cash value of inventories, growing crops, and processing commitments with futures contracts. Futures markets, which are an example of a riskreducing market institution, are widely available in industrial countries and help farmers to overcome price risk. In addition to futures and options markets, the most important risk-reducing alternatives include cooperative marketing and marketing boards. Zeuli (1999) discusses how agricultural cooperatives might enhance the risk-mitigation role they play for farmers.
Other studies in business economics and marketing-management literature have examined producers’ risks regarding marketing- channel contracting and financial management decisions. Smidts (1990, 1997) investigates farmers’ decision-making process with respect to the choice of a marketing strategy for potatoes grown for human consumption. Pennings and Wansink (2004) provide evidence, by integrating elements from both the marketing and finance literature, that the interaction between risk attitude and risk perception is a strong predictor of contract behaviour. Pennings and Smidts (2000) provide valuable insights regarding the role that the risk attitudes of farmers, who are managers of SMEs, play in dynamic markets, as reflected in their market-orientation and innovativeness, their desire to reduce fluctuations in profit margins, and their actual market behaviour (i.e., trading behaviour, choice of marketing channel, use of price-risk management instruments). Chatterjee et al. (1999) and Wang et al. (2003) discuss how price risks are associated with specific investments and how stakeholders need to diversify their product-portfolio when a firm is in financial (di)stress.
From this brief review on risk-behaviour of producers/investors, one may notice that risk preference may be viewed as a driver of producers, or in this instance, farmers’ operational, tactical as well as strategic decisions. The socioeconomic and demographic characteristics of farmers may affect their risk behaviour.
Consumer risk behaviour
Consumer risk behaviour is often investigated in terms of perceived risk (Bettman, 1973; Srinivasan and Ratchford, 1991; Bettman et al., 1998). This concept imbeds two main dimensions: (a) the perception of uncertainty, and (b) the seriousness of adverse outcomes. Thus, the focus of the perceived risk approach is on the potential negative outcomes that consumers may realise under uncertain conditions (Dowling and Staelin, 1994). For instance, if consumers are considering buying an unfamiliar food item which is on discount, for family consumption, their perceived risk associated with this specific consumption may arise since they do not know the taste of this food item (uncertainty) and they also worry about whether their family may enjoy eating this food item or not (negative outcome).
Consumers’ perceived risk may influence a variety of consumers’ choices and often leads to risk-handling activities (Dowling, 2006). The extent to which consumers’ perceived risk behaviour leads to risk-handling is mostly based on their ‘‘information sufficiency’’ (Griffin et al., 1999) and familiarity with the food product-related risks based on their past experience (Cox and Cox, 2001). The more ‘‘information sufficiency’’ as well as the more positive experiences perceived by a consumer, the more consumption of a food product is made (Fischer and De Vries, 2008). Costa-Font and Mossialos (2007) show that the combinations of communication policies with the effect of private information sources most likely influence consumers’ judgements regarding the risks of genetically modified food products. Fischer and Frewer (2009) confirm this result and predict that the level of consumers’ perceived risk, which is associated with foods, may be dependent on different psychological processes and is likely to be derived from deliberative information processing.
Most theoretical and empirical consumer research in the food domain that relies on the perceived risk approach has dealt with risks related to new and unfamiliar technologies such as sustainable food products (e.g., Eiser et al., 2002; Kalogeras et al., 2009), genetically modified (GM) food (e.g., Costa-Font and Mossialos, 2007; Gaskell et al., 2004), novel foods (e.g., Michaut, 2004), and residual contaminants within or on foodstuff that are derived from agrochemical practices (e.g., antibiotics and fumigants) and they are often the focus of consumer concern (e.g., Ropkins and Beck, 2000). Other studies in consumer risk literature have examined consumer risk reactions to food scares (e.g., De Jonge et al., 2004; Cleeren et al., 2008; Kalogeras, 2010) and consumers’ reactions towards food allergies (e.g., Putten et al., 2006).
However, following closely with research in other disciplines such as economics and statistical decision theory (e.g., Bazerman, 2001), recent work on consumer behaviour (e.g., Pennings et al., 2002; Schroeder et al., 2008; Kalogeras, 2010) elaborates a new risk approach that does not focus solely on the specific framing of negative consequences. Specifically, it has been argued that the decisions of consumers can be better understood by decoupling their risk behaviour into the separate components: attitude and perception. Such an approach enables more robust conceptualisations and predictions of investment and consumption decisions in highly risky environments (e.g., Pennings et al., 2002; Schroeder et al., 2008).
Particularly, Pennings et al. (2002) propose a new framework for examining consumer risk behaviour as consisting of two dimensions that play a crucial role in how consumers make decisions in a product- harm-crisis situation: (a) the content of risk; and (b) the chance of exposure to the risk content. These two dimensions are strongly linked to the two fundamental drivers of an individual’s decisionmaking behaviour under risk: risk attitude and risk perception. Risk attitude is formed by one’s predisposition to the content of the risk in a specific market situation and reflects a consumer’s interpretation of this risk content in a consistent way. Risk perception is related to a second dimension, i.e., the likelihood of one’s exposure to the content of the risk. It may be formed on the basis of the consumer’s own assessment of the chance to be exposed to the risk content associated with a particular market condition or inherent in a productrelated risky situation. The decoupling of consumer risk behaviour into the separate components of risk attitude and risk perception seems to be useful in financial and health-related domains, wherein wide differences between attitudes and perceptions may occur (e.g., MacCrimmon and Wehrung, 1990; Shapira, 1995). One may observe some analogies between the decoupling of risk behaviour into the separate components of risk attitude and risk perception with the hazard-risk model that is extensively used in health risk assessment (e.g., Moolgavkar, 2006). However, the hazard-risk model views the risk behaviour from only one perspective: the likelihood of harm in defined circumstances; it does not account for the extent to which an individual consumer may take a risk that may cause harm (i.e., hazard) to his/her health.
The literature reviewed above shows that risk is an important issue in business economics and marketing-finance literature, and that it has a significant impact on the economic behaviour of market participants (e.g., producers, consumers). Furthermore, it indicates the tight relationship of risk factors with the expected benefits (or returns) that market participants attempt to derive through the production and consumption of food products.
The return/benefit concept
In the language of business economics and, in particular, corporate finance and investing, the corporate decisions to issue debt and equity affecthowthe benefits (i.e., returns) pie is slicedup.[3] The way that the returns pie is sliced up between creditors (i.e., persons or institutions that buy debt from the firm) and shareholders (i.e., the holder of equity shares issued by a firm) affects the value of the firm (Ross et al., 2005). Thus, the goal is to choose the ratio of debt to equity that increases the value of the firm as much as possible. The goal, both at the corporate finance as well as individual investors’ decision-making level, is to invest (i.e., buy) assets that generate more returns on capital than they cost. In other words, these returns resemble the profit on capital investment that market participants make through handling of risk-bearing activities. In the previous section, we reviewed several works in business economics and management science and we showed that the extent of risk-taking activities of market participants affect their economic performance, and hence their returns/benefits.
In the 1950s, Markowitz (1952) developed the portfolio selection theory, which has been one of the most dominant theoretical angles in finance for the last 60 years. According to this theory, investors will only hold mean–variance efficient portfolios. This implies that the portfolios should maximise expected returns for a given level of risk. Traditionally, economics and finance theory support that market participants’ utility (returns/benefits) is derived from outcomes such as wealth, income and profit. That is, the outcome domain is always considered to be a monetary one, or otherwise, a utilitarian one. Yet, research in behavioural economics regarding investing (e.g., Hirschleifer, 2002; Hoffmann, 2007) and consumption (e.g., Holbrook and Hirschman, 1982; Millar and Tesser, 1986) supports that market participants have two kinds of evaluation systems. That is, decision-makers’ need for cognition regarding an investment or consumption object relies on: (a) a utilitarian dimension of instrumentality, and (b) a hedonic dimension.
Batra and Ahtola (1990) view the twodimensions of benefits, utilitarian and hedonic, on the basis of the multi-attribute ‘‘adequacyimportance’’ model. The first dimension of benefits, utilitarian, refers to how useful or beneficial the investment or consumption action is. The second evaluation dimension of benefits, hedonic, refers to the experiential affect associated with the investment and consumption. Recent research showed (e.g., Hoffmann, 2007) that both types of returns/benefits, in different degrees, contribute to the overall goodness of investing and consuming.
The two dimensions of benefits are neither mutually exclusive (e.g., an organic product may be both tasty and healthy) nor need to be evaluatively consistent (e.g., eating junk food at a young age, may in fact be bad for me at an older age). Although the major hypothesis, supported by a wide range of research, and related to utilitarian and hedonic benefits, is that, for most products and services, utilitarian attributes are more important than the hedonic, nowadays, there is a plethora of studies in finance, marketing and behavioural economics which account for both dimensions of benefits considered by the market participants. There is ample evidence that the hedonic dimension regarding food consumption dominates often the utilitarian dimension. The hedonic responses of consumers are rooted in the general pleasure derived from their taste preferences that reflect a combination of all chemosensory and physical stimulation from food and gestation, and, hence, from their foods ‘‘likings’’ (Wansink, 2007). These ‘‘food likings’’ may form consumers’ desires, perceptions and attitudes for eating foods that make them sense a greater pleasure (e.g., due the taste of sweetness) in general and, thereby select these better-liked foods more frequently and in larger portions (Mela, 2001). Of course, one may realise the potential harms of such human sensory and hedonic responses: frequent selection of better-liked foods, including, for instance, sweetening and fats, which are offered at large portion sizes at many retailing spots, may lead to serious obesity and other health-related problems (Cox et al., 1998; Wansink and Van Ittersum, 2007).
In food marketing literature the attitudes and perceptions of consumers towards perceived benefits before, during and after the consumption of food items are based on their quality judgments about specific revealed or hidden benefits derived through consumption (Junand Jolibert, 1983).These judgements depend onthe perceptions, needs and goals of the consumer and formulate what is called perceived quality (Ophuis and van Trijp, 1995). Steenkamp (1989, 1990) and van Ittersum et al. (2003) define perceived quality as the fitness for use, given the needs of the consumer, and Monroe and Krishnan (1985) emphasise the perceived ability of a product to provide satisfaction relative to available alternatives. The literature on perceived product quality makes a distinction between a product’s quality attributes andcues.Quality attributes are thefunctional andpsychological benefits or consequences provided by the product. They represent what the product is perceived to provide for the consumer and, in that sense, quality attributes are unobservable prior to consumption. On the contrary, quality cues are the informational stimuli related to the quality of the product and can be ascertained by the consumer throughher senses prior to consumption (Dimara et al., 2001).Quality cues are categorised as either intrinsic or extrinsic (Jacoby et al., 1971; Kirmani and Rao, 2000). Intrinsic cues often refer to product features such as colour, aroma, taste, among others,while extrinsic cues are related to the product but are not physically part of it (e.g., price, brand name, country of place of origin, certificate) (Steenkamp, 1990). Hence, one may argue that extrinsic cues are more associated with utilitarian benefits and intrinsic cues with hedonic benefits (Dimara et al., 2001). Both sets of cues may act as signalling mechanisms for product quality through effective communication efforts at the different stages of the food supply chain, and particularly, at the end-consumermarkets (Northen, 2000).
Benefit–risk trade-offs: measurement issues
Extensive research has been done on how to measure benefit– risk trade-offs. In the literature, two major approaches towards risk attitude measurement can be distinguished: measures derived from the utility framework (von Neumann and Morgenstern, 1947; Schoemaker, 1982; Fishburn, 1988), and measures derived from psychometrics (e.g., Miller et al., 1982; MacCrimmon and Wehrung, 1986; Shapira, 1995). Since the way in which risk attitude is conceptualised and measured affects our understanding of decision-making under risk, it is important to understand the validity of risk-attitude and return/benefit measures.
Major approaches
The EU approach
The EU model formulates decision-making under risk as a choice between alternatives, each represented by a probability distribution. Decision-makers are assumed to have a preference ordering defined across the probability distributions. Risky alternatives can be ordered using the utility function u(x). In this model, the curvature of the utility function u(x) reflects risk attitude (Keeney and Raiffa, 1976). It is important to note that risk attitude refers to the curvature of the utility function for a specific domain, e.g., monetary outcomes of a business. Within the expected utility approach, one can also adjust the utility for strength of preference, in order to obtain a more accurate measure of risk attitude: the intrinsic (relative) risk attitude (Ellsberg, 1954; Dyer and Sarin, 1982; Bell and Raiffa, 1982). The intrinsic risk attitude approach assumes that an individual’s preference for risky choice alternatives is a combination of: (1) the strength of preference an individual feels for certain outcomes (e.g., monetary) and (2) attitude towards risk (cf. Smidts 1997). The outcomes of a lottery are transformed into subjective values under certainty by the strength-ofpreference function v(x), and these subjective values are subsequently evaluated under risk.[4]
The psychometric approach
In the standard psychometric approach, constructs such as risk attitude are measured by asking respondent to indicate the extent to which they (dis)agree with a set of statements (Nunnally and Bernstein, 1994). Kunreuther and Ginsberg (1978), MacCrimmon and Wehrung (1986), and Shapira (1995), amongst others, conducted large-scale surveys and interviews investigating risk preferences using psychometric scaling procedures. Several researchers developed semantic scales of risk attitude and tested their psychometric properties (e.g., Jaworski and Kohli, 1993; Childers, 1986; Pennings and Smidts, 2000). For example, Pennings et al. (2002) and Kalogeras (2010), in order to measure the risk attitude of consumers during the different phases of a product-harm crisis (e.g., BSE crisis or Avian Influenza crisis), used items such as: (1) For me, eating beef/chicken products is worth the risk (‘‘strongly disagree’’ to ‘‘strongly agree’’); (2) I am . . . ‘‘not willing to accept’’ to ‘‘willing to accept’’ the risk of eating beef/chicken; and (3) I do not accept the risks of eating beef/chicken (‘‘strongly disagree’’ to ‘‘strongly agree’’). In addition, following the psychometric approach, a plethora of constructs such as perceived utilitarian and/or hedonic benefits are often measured by items regarding how pleasantunpleasant, meaningful-meaningless, happy-sad, valuable-worthless, among others, the consumption of a product may be. The works of Levin (1965), Batra and Ahtola (1990), Voss et al. (2003), among others, show that certain items (e.g., positive, good, favourable, rewarding) are important for the measurement of both utilitarian and hedonic benefits, thereby apparently reflecting what one may call overall attitude towards perceived benefits. Yet, there are several items (e.g., valuable, wise, safe, ordered, sane) that are considered as measuring almost always utilitarian benefits, while others (e.g., pleasant, beautiful, pleasing, happy, comfortable) are almost always hedonic benefits.
Pennings and Smidts (2000) compared the two major approaches (expected utility vs. psychometrics) based on their convergent, discriminant, and nomological validity, using data obtained from computer- assisted interviews with 346 owner-managers who made decisions about their own businesses.[5] While the measures demonstrate some degree of convergent validity, the measures based on the utility framework predicted actual market behaviour better than the psychometric scale. In contrast, the psychometric scale showed more coherence with self-reported measures, such as innovativeness, market orientation, and the intention to reduce risk. In the light of the apparently higher predictive validity of the utility-based measurements, Pennings and Smidts (2000) recommended elicitation methods based on the utility paradigm for understanding managerial decision-making under risk.
Utility elicitation techniques
In Table 1, we depict four utility elicitation techniques that have been frequently proposed theoretically and used in measuring utility and benefit–risk trade-offs. We selected these four elicitation techniques based on the following criteria: (a) the degree of predictive validity, (b) suitability for measuring risk attitudes using a survey-based instrument or experimental design, and (c) the easiness of the task for the respondent. Here, we do not discuss these criteria, but present the procedures for measuring the decisionmaker’s risk attitude. The relevance of these criteria has been identified in the literature and are presented in Table 1.[6] Below, we discuss briefly these measurement techniques.
Table 1 Elicitation techniques for utility/benefit–risks trade-offs.
| Measurement techniques | Authors |
|---|---|
| Utility function: u(x) | |
| I. Certainty Equivalence (CE) | Fisburn (1967), Hull et al. (1973), Keeney and Raiffa (1976), LaValle (1978), and Pennings and Smidts (2000)I. Certainty Equivalence (CE) |
| II. Conjoint | Tversky (1967), Anderson and Shanteau (1970), Wind (1982), Corstjens and Weinstein (1982), and Smidts (1990) |
| III. Willingness-to-trade-off | Sarin and Weber (1993), Weber and Milliman (1997), and Weber and Hsee (1998) |
| IV. Standard sequence | Wakker and Denefee (1996) and Abdellaoui (2000) |
The CE technique
One of the most commonly-used techniques to measure risk attitudes rooted in the expected utility framework is the Certainty Equivalence (CE) technique. The respondents are presented with an uncertain prospect, usually a binary lottery (e.g., lottery with two outcomes) and they are asked to state a certain outcome w, called certainty equivalent.[7] Each choice situation requires that the respondents choose between a certain outcome and a binary lottery (Keeney and Raiffa, 1976). The respondents keep specifying w, until they become indifferent between the lottery and the certain outcome. This indifference is arrived in an iterative manner. A sequence of points is successively adjusted until indifference is established. After the respondents have indicated that they are indifferent between the certain outcome and the uncertain prospect, a point at the respondents’ utility function is obtained. A sequence of successive bisections results in a number of points of the utility function. The curvature of the utility function that is obtained from these utility points is a measure of risk attitude.
Fig. 1 shows an example of the results that one can obtain by using the CE technique. We will briefly explain this procedure using an example that could be used in the context of benefit– risk analysis. In this example, the CE technique is formulated in terms of relatively high/low returns on investments with a range of –5% to +20%, with a probability of 0.5 (e.g., Alternative A) and a fixed return (e.g., Alternative B). Alterative A may be thought of as the transition from a conventional to a sustainable production system. This alternative is risky, since the return on the investment of such a production system is unknown at the time that the decision-maker (i.e., farmer) makes the decision as to whether to switch to a sustainable production system or not. Alternative B represents the conventional production system. In this example we assume that the return on investment for a conventional system is known (e.g., fixed return on investment). The assessment of the CE is an iterative process. This measurement procedure can be computerised. If a farmer chooses alternative A (the 50/50 high/low return), the computer will randomly generate a higher fixed return (alternative B) than the previous, thus making alternative B more attractive or a lower fixed price, making alternative A more attractive. If a farmer chooses alternative B, the computer will generate randomly a lower or higher fixed return (alternative B) the next time, thus making alternative A (alternative B) more attractive. The next measurement will start after the farmer indicates as being indifferent between alternative A or B. Various points can be assessed. Fig. 1 shows that 5 points of the utility function are assessed. Each lottery that is played is depicted in Fig. 1 as x1, x2, . . . ,x5 (e.g., Pennings and Smidts, 2000).

The conjoint technique
An alternative method for measuring risk attitude is using the conjoint technique. This technique is very popular in marketing and consumer behaviour research (Green and Srinivasan, 1978). The conjoint measurement allows the analysis of preferences of multi-attribute choice alternatives. Instead of providing indifference judgments, as with the CE (lottery) technique, the respondent has to rate or rank-order a set of hypothetical profiles which consist of specific sets of levels (one per factor), known as stimulus (Tversky, 1967; Wind, 1982; Corstjens and Weinstein, 1982). Each profile consists of a combination of levels for a number of attributes. Using appropriate estimation techniques (e.g., Ordinary Least Squares), the trade-off between levels of attributes can be obtained. Smidts (1990, 1997) specified two models to estimate the risk attitude of 218 Dutch farmers. These are the Mean-Standard Deviation Model (MSD), which asks a respondent to make a tradeoff between expected value (mean) and standard deviation (risk), and the Ideal-Point model (IP), which makes a non-linear relationship between expected value and risk possible by including the variance assigned to a hypothetical conjoint profile (Coombs, 1975; MacCrimmon et al., 1980). In contrast to expectancy-value techniques that utilise compositional approaches, the conjoint technique is based on a decompositional approach, in which subjects judge a set of ‘‘total’’ profile descriptions. A profile in this context is a bundle of attributes that make up the product/service. This approach, which is based on some type of composition rule (i.e., additive or multiplicative), results in a set of part-worths (i.e., values) for individual attributes that are most consistent with the subject’s overall risk preferences (Green and Srinivasan, 1978).
The WT technique
The risk-return (i.e., risk-value) models also allow the estimation of risk attitude in a decompositional manner (e.g., Levy and Markowitz, 1979). In the risk-returns models, the valuation of a risky prospect can be influenced by both the expected value of a prospect and its riskiness (Jia et al., 1999). Based on this notion, the decision maker’s risk preference can be estimated (Sarin and Weber, 1993), utilising a technique that takes into consideration his/her willingness to trade-off (WT) risk against a potential outcome (e.g., return). The respondent expresses an evaluation in terms of the amount of money that he/she is willing to pay for an uncertain option (X), and makes a judgment of perceived risk (R), typically using a rating scale.[8] The estimation of the decision maker’s risk parameter can be interpreted as the relative weight assigned to risk, relative to expected return (Weber and Hsee, 1998).
Recently, Pennings and Kleinmuntz (2005) have developed an extended
WT (EWT) risk preference measure in order to derive the
decision maker’s intrinsic risk preferences. They assess the subjective
value of risky financial options X in theWTtechnique. First, they
use the CE technique to assess the objective expected value of a risky
option X, and then they express this value in terms of the potential
outcome (e.g., returns). The WT judgments of decision-makers are
regressed on the subjective values of each risky option X and the
decision maker’s perceived risk for each option: EWT(X) = 
 V(X) +
 R(X), where V(X) represents the subjective expected value
obtained from the decision maker’s strength-of-preference function,
and parameters
R(X), where V(X) represents the subjective expected value
obtained from the decision maker’s strength-of-preference function,
and parameters  , , and are the intercept and the
regression weights, the latter reflecting the decision maker’s risk
preference.
, , and are the intercept and the
regression weights, the latter reflecting the decision maker’s risk
preference.
The standard-sequence technique
Abdellaoui (2000) proposed a two-step procedure to successively
elicit an individual’s utility function u(x) and the probability weighting
function w(x). In decision-making under risk, the psychological
weight assigned to an outcome may not correspond to the probability
of that outcome. The stimulus x in this context can be thought of
as the return on investment of a sustainable production system. The
w(x) permits probabilities to be weighted non-linearly, so that framing
effects (caused by a special sequencing of choice questions,
which may also cause probability distortion) are avoided (Gonzalez
and Wu, 1999). The first step of Abdellaoui’s (2000) procedure is to
use Wakker and Denefee’s (1996) trade-off technique to elicit u(x).
The trade-off technique works as follows. Define a two-outcome lottery
[x, p; z] as a lottery that yields outcome x with probability p and
outcome z with probability 1 – p. An individual is asked to compare
lotteries [x0, p; Z] and [x1, p, z], where x1 < x0 < Z < z. The values of p, z,
x0, and Z are fixed and x1 is varied until the individual reveals the following
indifference: [x0, p; Z] ~ [x1, p; z], where ‘~’ denotes indifference.
Then the process is repeated and the individual is asked to state
the level of x2, such that [x1, p; Z] ~ [x2, p, z]. Once these indifferences
are identified, it follows that u(x1) – u(x0) = u(x2) – u(x1). That is,
this technique allows the determination of equally spaced utility
intervals or a ‘‘standard-sequence’’ of outcomes.[9] The process can be
repeated for any number of desired indifferences, x0, . . . ,xn. As shown
in Wakker and Denefee (1996), a utility index can be constructed, such that u(x ) =
) =  for = 1,. . .,n. Abdellaoui (2000) showed that once a
standard sequence of outcomes, x0 . . . ,xn, has been determined using
the method above, a standard sequence of probabilities can be determined
in a similar fashion, such that a probability weighting function
can be estimated. This allows one to determine whether an individual
over- or under-weights low-, medium-, and high-probability events.
Wakker and Deneffe’s (1996) utility elicitation approach is advantageous,
because (p. 1131) ‘‘it is robust against probability distortions
and misconceptions, which constitute a major cause of violations of expected
utility and generate inconsistencies in utility elicitation.’’ As such,
the trade-off approach permits unbiased estimation of utility
functions.
for = 1,. . .,n. Abdellaoui (2000) showed that once a
standard sequence of outcomes, x0 . . . ,xn, has been determined using
the method above, a standard sequence of probabilities can be determined
in a similar fashion, such that a probability weighting function
can be estimated. This allows one to determine whether an individual
over- or under-weights low-, medium-, and high-probability events.
Wakker and Deneffe’s (1996) utility elicitation approach is advantageous,
because (p. 1131) ‘‘it is robust against probability distortions
and misconceptions, which constitute a major cause of violations of expected
utility and generate inconsistencies in utility elicitation.’’ As such,
the trade-off approach permits unbiased estimation of utility
functions.
Behavioural economics research indicates that assessments of utility functions and benefit/return-risk trade-offs should be considered a difficult task which must be handled with great care (Farquhar, 1984). According to Smidts (1990), the following issues should be considered when eliciting utility functions: providing a clear and unambiguous decision context, specifying the attribute of interest clearly, training the respondent and the interviewer in the assessment task, and checking for inconsistencies in responses. Furthermore, it is recommended to have more than one technique to elicit the utility function and the value function, since this ensures that the conclusions regarding the relationship between the shape of the utility function and economic behaviour are going to be method-invariant.
Utility functional forms
There are various algebraic specifications of a utility function that often give similar measures of goodness of fit to elicit utility points (Hardaker et al., 2004). In Table 2, five utility functional forms are displayed. The description of the functional specifications and the related discussion on their risk properties are beyond the scope of this position paper, but are readily available in Farquhar and Namakura (1987) and the cited literature in Table 2. However, we should briefly mention here that many decision theoreticians support the notion that the measures of absolute risk aversion, as indicated by the Pratt–Arrow coefficient of risk-attitude, provide one way for choosing suitable forms (Arrow 1971).[10] Smidts (1990) discussed behavioural assumptions, relying on Tsiang’s (1972) proposed conditions for the acceptability of a utility functional form (where the attribute is wealth). First, the utility function of wealth is assumed to be increasing and this implies that a decision-maker is risk-averse towards wealth (concave-shaped). Second, if a decision-maker becomes wealthier, (s)he is equally or less risk-averse for equal absolute changes in his/her wealth (i.e., plus or minus an amount of money) and equally or more risk-averse for proportional changes in wealth (e.g., plus or minus 10% of his/her wealth).
Several studies in business economics confirm the assumption of the decreasing absolute risk attitude (e.g., Hamal and Anderson, 1982; Hildreth and Knowles, 1986). One of the functions that meet the above behavioural assumptions is the negative exponential function. According to Eliasheberg and Hauser (1985) the negative exponential utility functions dominate decision theory and analysis. Recent theoretical and empirical work proposes that the inverse power transformation function (e.g., Meade and Islam, 1995; Pennings and Smidts, 2003) and the polynex utility functions (sum of polynomials and exponential functions) (e.g., Namakura, 1996) are functional forms that exhibit great flexibility with respect to increasing or decreasing risk aversion over the whole outcome domain.
Table 2 Utility functional forms.
| Utility forms u(x) | Authors |
|---|---|
Quadratic: 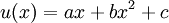
|
Hicks (1962), Arrow (1965), Bell (1988), Levy (1992), and Jia and Dyer (1996) |
Log Inverse Power Transformation: ![u(x)=\frac{1}{1+exp[-a-\beta(1/K)log(1+KX)]}](/en-opwiki/images/math/3/a/f/3af6f9d27f15a3bc1510ac628bb5403a.png) , Point of Inflection: , Point of Inflection: 
|
Luce (1980), Bewley and Fiebig (1988), Meade and Islam (1995) and Pennings and Smidts
(2003) |
Negative Exponential: 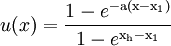
|
Tsiang (1972), Sarin (1987), Bell (1995), Pennings and Leuthold (2000), Pennings and Smidts
(2003), and Pennings and Garcia (2005) |
Polyneux: 
|
Brockett and Golden (1987), Bell (1988), Farquhar and Namakura (1987), Saha (1993),
Namakura (1996) |
Multiattribute: 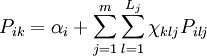
|
Tversky (1967), Green and Srinivasan (1978), and Bell (1979) |
Proposed research framework
After reviewing the theoretical, methodological, and measurement advances in decision-making under risk, by making special references related to the context of this review paper (i.e., benefit– risk analysis in business economics and marketing-finance), we propose a conceptual model that is based on the decoupling of risks and benefits into different components. That is, our proposed conceptualisation is based on new risk management theory and avoids the methodological and measurement biases related to the traditional perceived risk approach (i.e., focusing only on the negative outcomes).
Based on the seminal works of Arrow (1971), Pratt (1964), Pennings et al. (2002), and Pennings and Wansink (2004) provide further insights into the separate components of consumer risk behaviour. They argue that not only risk attitude and risk perception drive consumer risk behaviour, but also their interaction (Pennings and Wansink, 2004; Appendix A). The interaction between risk attitude and risk perception reflects that relatively risk-averse consumers may engage in behaviour that reduces risk, and that this becomes more prominent as consumer perceives relatively more risk (Pennings and Smidts, 2000). Moreover, closely following recent advances in behavioural economics and marketing (e.g., Millar and Tesser, 1986; Batra and Ahtola, 1990; Fischer and Frewer, 2009; Voss et al., 2003), we assume that the decoupling of benefits into the separate components of utilitarian and hedonic benefits and the interaction of the two may also reveal crucial information about the relative impact that these two dimensions may have separately, which compose the overall attitude towards benefits, on economic behaviour (e.g., consumption). Based on this benefit–risk approach (i.e., decoupling risk-taking and benefit behaviour into the separate components of risk attitudes, risk perception, and their interaction, as well as utilitarian benefit, hedonic benefit and their interaction), we hypothesise that the decision-making behaviour of an individual consumer (e.g., the decision whether or not to reduce consumption of a product/service due to an unexpected crisis), say in a product-harm crisis situation (e.g., the BSE crisis; the Avian Influenza crisis), can be formulated as:
CBR =  (RA + RP + RA
  RP + UB + HB + UB HB)
where (i) CBR is the benefit–risk behaviour of consumer , (ii) RA is
the risk attitude of consumer , (iii) RP is the risk perception of consumer
, and (iv) RA RP is the interaction between risk attitude
and perception of consumer , (v) UB is the utilitarian benefit of
consumer , (vi) HB is the hedonic benefits of consumer , and finally,
(vii) UB HB is the interaction between utilitarian and hedonic
benefits of consumer .
The insights that may result from decoupling risk attitudes and risk perceptions as well as utilitarian and hedonic benefits may yield important managerial implications for policy-makers, financial analysts, industry managers and marketers. One may consider the following implications:
Implication 1: Suppose that risk attitude drives the benefit–risk behaviour of individuals regarding the consumption of a likely harmful product. This would suggest that policy makers and managers will have to focus on eliminating the risk content involved in a particular situation using strategies such as partial/total product recall or elimination of the product in the food supply chain (e.g., slaughtering the cows/chickens).
Implication 2: Suppose that risk perception drives the benefit– risk behaviour of individuals regarding consumption of a likely harmful product. This would suggest that policy makers and marketers will have to focus on effectively communicating the ‘‘true’’ level of risk, and thus the ‘‘true’’ probabilities of being exposed to risk content (e.g., conducting a fatal, or less severe, disease through the consumption of a harmful product).
Implication 3: Suppose that perceived utilitarian benefits (e.g., price, brand-name) drive the benefit–risk behaviour of individuals during a product-harm crisis. This would suggest that managers and marketers will have to focus on ways that enhance the promotion of the suspected food item by signalling its quality through the use of extrinsic cues such as place/country of origin- or nutritionrelated certification, label information, good price, among others.
Implication 4: Suppose that the perceived hedonic benefits (e.g., taste, aroma, colour) drive the benefit–risk behaviour of individuals during a product-harm crisis. In such a case, industry managers and marketers will have to focus on signalling the product’s quality through the promotions of its intrinsic cues.
Several scholars have claimed that attitude and perception formations as well as change are driven by exposure to episodic events occurring in dynamic market environments (e.g., Payne et al., 1993; Bettman et al., 1998). Kalogeras et al. (2009) support that the decoupled decision-making behaviour of individuals can be adaptive to the specificities of ‘‘real-world’’ contingent market conditions. That is, the decoupled components (RA, RP, UB, HB) determining benefit–risk trade-offs of individuals may change in terms of magnitude and significance over time (e.g., within and across different phases of a product-harm crisis). Thus, an extension of the proposed research framework may account for the identification and evaluation of the factors influencing such changes. Marketing theory suggests that the most common drivers of attitude and perception formations over time are those related to the levels of the knowledge that individuals acquire (Moorman et al., 2004; Hui et al., 2009) and trust in information provided by governmental agencies and industry (Bocker and Hanf 2000; Eiser et al., 2002), respectively.
Conclusions
The identification and evaluation of the factors that drive the benefit–risk trade-offs of market participants are important issues in business economics and marketing-finance. The dominant paradigm that economists, financial analysts and marketers mostly rely on their evaluations regarding the benefit–risk trade-offs of market participants (e.g., food producers, consumers) is the expected utility model. Yet, recognising that the decision-making process may have a dual facet (e.g., cognitive and affective), many measurement methods rooted in psychometrics are also utilised.
After reviewing the importance and impact of benefit–risk trade-offs on market participants’ decisions as well as measurement methods and techniques that allows us to address this importance and the factors influencing this trade-off in specific decision contexts, we propose a new research framework. This framework relies on the decoupling of benefit and risk components. By decoupling benefit–risk behaviour of market participants into different components and examining their impact on the economic behaviour, a more robust conceptualisation and prediction of market participants’ reactions may be possible. This offers interesting avenues for future research. Predicting and understanding the benefit–risk behaviour of market participants may be particularly critical for public policy-makers, financial analysts and marketers who need to understand the drivers of economic behaviour at different stages of the food supply chain (e.g., production, marketing, and consumption).[11]
Conflict of Interest
The authors declare that there are no conflicts of interest.
Acknowledgements
The preparation of this manuscript was funded through the Safefoodera project BEPRARIBEAN (project ID 08192) by the Dutch Food and Consumer Product Safety Authority (VWA), the Research Council of Norway (RCN) and the Nordic Council of Ministers (NCM), and supported by MATIS, The National Institute for Health and Welfare (THL) and Ulster University.
Footnotes
- ↑ Knight (1933) makes a distinction between risk and uncertainty. The term risk refers to the situation where the decision-maker knows the probabilities associated with the possible consequences, while the term uncertainty refers to the situations in which these probabilities are not known. In this paper, consistent with marketing literature, we use the term risk to mean uncertainty.
- ↑ The newly emerged marketing-finance interface stresses the pivotal strategic relationships among marketing and finance in today’s firms. It concentrates on how marketing actions drive shareholder value. In this paper, we review literature on the marketing-finance interface, since it emphasises how to ensure business success through the evaluation of benefit–risk trade-offs of market participants (e.g., investors, producers, consumers).
- ↑ In business economics and, particularly, in finance, the term ‘‘benefit’’ is often referred to as ‘‘returns’’ and is of a monetary nature. That is, we use interchangeably the term ‘‘returns’’ and ‘‘benefits’’.
- ↑ In a given decision problem each possible outcome or consequence can be identified with a particular level x in the attribute set X. X denotes a subset of real numbers representing the possible levels of a single attribute such as return on investment, net asset value, response time, etc. In examining risky decision problems we treat alternative decisions as ‘‘gambles’’ or ‘‘lotteries’’ over the finite sets of outcomes from X (Farquhar, 1984).
- ↑ Converged validity refers to the degree to which different measurements reflect the same construct, i.e., are positively correlated (Cook and Campbell, 1979). Discriminant validity is achieved when there is a divergence between measures of one construct and a related but conceptually distinct construct. Nomological validity refers to whether measures are related to other constructs in a way that is theoretically meaningful (Pennings and Smidts, 2000).
- ↑ For an extensive review on utility assessment methods based on other criteria, the reader is referred to Farquhar (1984) and Smidts (1990, pp. 151–163).
- ↑ A binary lottery (i.e., lotteries with two outcomes) is denoted as [x1, p, x2] which stands for a lottery which yields outcome x1 with probability p and outcome x2 with probability (1 – p). If either p = 0, p = 1 or x1 = x2, the lottery is degenerate because the outcome is certain. A preference comparison of two binary lotteries involves the following expression: [x1, p, x2] R [x3, q, x4] which denotes the preference relation between the lotteries, and consists of : > (is more preferred than), < (is less preferred than) or = (is indifferent to). For example if the respondent is offered two lotteries in which four outcomes as the probabilities p and q are fixed, he has then to specify the unspecified item: the preference relation R between the two lotteries. If, on the other hand, the four outcomes (x1 to x4) and their probabilities are fixed and if R is specified as =, then the respondent has to specify probability q so that he is indifferent between the lotteries.
- ↑ The perceived riskiness of a choice alternative may depend on a person’s reference point that can be manipulated by outcome framing and the outcome history of preceding decisions (Schurr, 1987). Weber and Milliman (1997) suggest that the differences in risky choices between decision makers should not automatically be interpreted as the result of decision makers’ preferences for risk, but may also be the result of changes in their perception of the risks.
- ↑ A standard sequence of x0, . . . ,xn needs the construction of n differences [x
 , p,
Z] ~ [x, p, z], i = 1, . . . ,n.
, p,
Z] ~ [x, p, z], i = 1, . . . ,n.
- ↑ Risk aversion is indicated by a utility function that shows decreasing marginal
utility as the level of the pay-off increases. The simplest measure of risk aversion,
which is constant for a positive linear transformation of the utility function, is the
absolute risk aversion function
 , where
  and
and  represent the second
and the first derivatives of the utility function, respectively (Pratt, 1964; Arrow,
1965), and w represents the decision maker’s wealth.
represent the second
and the first derivatives of the utility function, respectively (Pratt, 1964; Arrow,
1965), and w represents the decision maker’s wealth.
- ↑ Our framework does not focus on the prediction and explanation of how benefitrisk trade-offs of several market participants (consumers vs. retailers/producers) may move in different direction (i.e., promotion of a food item that may be not considered as ‘‘safe’’’’ because it was produced by the intensive use of agrochemicals may result in certain economic benefits, whereas the consumption of this food item may increase the health-related risk of consumers). Its focus is rather on how we may better predict and explain the benefit-risk trade-offs of specific market participants, say consumer, by decoupling the two core concepts involved in this trade-off: benefits and risks. Knowledge on the drivers of the benefit-risk trade-offs’ behavior of consumers, may in turn inform the making up of strategies or policies that other market participants (e.g., policy-makers, producers, retailers) may use in order to deal with highly uncertain situations (e.g., food scares) in certain decision contexts.
References
Abdellaoui, M., 2000. Parameter-free elicitation of utility and probability weighting functions. Manage. Sci. 46, 1497–1512.
Anderson, J.R., Dillon, J.L., Hardaker, B., 1977. Agricultural Decision Analysis. Iowa State University Press, Ames.
Anderson, N.H., Shanteau, J.C., 1970. Information integration in risky decision making. J. Exp. Psychol. 84, 441–451.
Antwood, J.A., Bushema, D.E., 2003. Evaluating the magnitudes of financial transactions costs on risk behaviour. Agric. Syst. 75, 235–249.
Arrow, K.J., 1965. Aspects of the Theory of the Risk Bearing, Yrjö Jahnssonin Säätiö. Academic Bookstore, Helsinki.
Arrow, K.J., 1971. Essays in the Theory of Risk Bearing. Markham, Chicago.
Baourakis, G., Kalogeras, N., Mattas, K., 2011. Introduction to the special issue on recent trends in the food industry and food chain. J. Food Products Market. 17, 1–3.
Batra, R., Ahtola, O.T., 1990. Measuring hedonic and utilitarian sources of consumer attitudes. Market. Lett. 2, 159–170.
Bazerman, M.H., 2001. Judgment in Managerial Decision-Making. Wiley, New York.
Bell, D.E., 1995. Risk, return and utility. Manage. Sci. 41, 21–30.
Bell, D.E., 1979. Multiattribute utility functions: decomposition using interpolation. Manage. Sci. 25, 744–753.
Bell, D.E., 1988. One switch utility functions and a measure of risk. Manage. Sci. 34, 1416–1434.
Bell, D.E., Raiffa, H., 1982. Marginal value and intrinsic risk attitude. In: Kunreuther, H. (Ed.), Risk: A Seminar Series. International Institute for Applied Systems Analysis, Laxenburg, Austria, pp. 325–349.
Bettman, J.R., 1973. Perceived risk and its components, a model and empirical test. J. Market. Res. 10, 184–190.
Bettman, J.R., Luce, M.F., Payne, J.W., 1998. Constructive consumer choice processes. J. Cons. Res. 25, 187–216.
Bewley, R., Fiebig, D.G., 1988. A flexible logistic growth model with applications in telecommunications. Int. J. Forecasting 4, 177–192.
Biswanger, H.P., 1980. Attitudes toward risk: experimental measurement in rural India. Am. J. Agric. Econ. 62, 395–407.
Bjornson, B., Carter, C.A., 1997. New evidence on agricultural commodity return performance under time-varying risk. Am. J. Agric. Econ. 79, 918–938.
Bocker, A., Hanf, C.H., 2000. Confidence lost and partially – regained: consumer response to food scares. J. Econ. Behav. Organ. 43, 471–485.
Bond, G.E., Wonder, B., 1980. Risk attitudes amongst Australian farmers. Aust. J. Agric. Econ. 24, 16–33.
Bousard, J.M., Petit, M., 1967. Representation of farmers behaviour under uncertainty with a focus-loss constraint. J. Farm Econ. 49, 869–880.
Brink, L., McCarl, B., 1978. The trade-off between expected return and risk among corn-belt farmers. Am. J. Agric. Econ. 60, 259–263.
Brockett, P.L., Golden, L.L., 1987. A class of utility functions containing all the common utility functions. Manage. Sci. 33, 955–964.
Carlson, G., 1970. A decision theoretic approach to crop disease prediction and control. Am. J. Agric. Econ. 52, 216–223.
Carlson, G., 1988. Economics of biological control of pests. Am. J. Altern. Agric. 3, 110–116.
Chatterjee, S., Lubatkin, M., Schulze, W.S., 1999. Toward a strategic theory of risk premium: moving beyond CAMP. Acad. Manage. Rev. 24, 556–567.
Childers, T.L., 1986. Assessment of the psychometric properties of an opinion leadership scale. J. Market. Res. 23, 184–188.
Cleeren, K.H.H., Dekimpe, M.G., Helsen, K., 2008. Weathering product-harm crises. J. Acad. Market. Sci. 36, 262–270.
Collins, R.A., 1997. Towards a positive economic theory of hedging. Am. J. Agric. Econ. 79, 488–499.
Coombs, C.H., 1975. Portfolio theory and the measurement of risk. In: Kaplan, M.F., Schwartz, S. (Eds.), Human Judgment and Decision Processes. Academic Press Inc., New York, pp. 63–85.
Corstjens, M.L., Weinstein, D., 1982. Optimal strategic business units portfolio analysis. In: Zoltners, A.A. (Ed.), Marketing Planning Models. TIMS Studies in The Management Sciences 18, Amsterdam, North Holland, pp. 141– 160.
Costa-Font, J., Mossialos, E., 2007. Are perceptions of risks and benefits of genetically modified food (in)dependent? Food Qual. Prefer. 18, 173–182.
Cox, D., Cox, A.D., 2001. Communicating the consequences of early detection: the role of evidence and framing. J. Market. 65, 91–103.
Cox, D.N., Van Galen, M., Hedderley, D., Perry, L., Moore, P., Mela, D.J., 1998. Sensory and hedonic judgments of common foods by lean consumers and consumers with obesity. Obes. Res. 6, 438–447.
Cook, T.D., Campbell, D.T., 1979. Quasi-experimentation: design and analysis for the field settings. Rand McNally, Chicago, IL.
De Jonge, J., Frewer, L.J., van Trijp, H., Renes, R.J., De Wit, W., Timmers, J., 2004. Monitoring consumer confidence in food safety: an exploratory study. Brit. Food J. 106, 837–849.
Dillon, J.L., Scandizzo, P.L., 1978. Risk attitudes of subsistence farmers in northeast Brazil: a sampling approach. Aust. J. Agric. Econ. 60, 425–435.
Dimara, E., Kalogeras, N., Baourakis, G., 2001. Consumer preferences for extrinsic versus intrinsic quality cues for image products: the case of Greek quality wine. In: Zopounidis, C., Pardalos, P., Baourakis, G. (Eds.), Fuzzy Sets Systems in Management, Economics & Marketing. World Scientific Publications, Singapore, pp. 83–98.
Dowling, G.R., 2006. Perceived risk: the concept and its measurement. Psychol. Market. 3, 193–210.
Dowling, G.R., Staelin, R., 1994. A model of perceived risk and intended riskhandling activity. J. Cons. Res. 21, 119–134.
Dyer, J.S., Sarin, R.K., 1982. Relative risk aversion. Manage. Sci. 28, 875–886. Eeckhoudt, L., Golier, C., Schlesinger, H., 2005. Economic and Financial Decisions under Risk. Princeton University Press, US.
Eiser, J.R., Miles, S., Frewer, L.J., 2002. Trust, perceived risk, and attitudes toward food technologies. J. Appl. Soc. Psychol. 32, 2423–2433.
Eliasheberg, J., Hauser, J.R., 1985. A measurement approach for modelling consumer risk preference. Manage. Sci. 31, 1–25.
Ellsberg, D., 1954. Classic and current notions of measurable utility. Econ. J. 64, 528– 556.
Farquhar, P.H., 1984. Utility assessment methods. Manage. Sci. 30, 1283–1300.
Farquhar, P.H., Namakura, Y., 1987. Constant exchange risk properties. Oper. Res. 35, 206–214.
Feder, G., Just, R.E., Zilberman, D., 1982. Adoption of Agricultural Innovation in Developing Countries: A Survey. World Bank Staff Working paper No. 542. The World Bank, Washington, DC.
Fisburn, P.C., 1967. Methods of estimating additive utilities. Manage. Sci. 13, 435– 453.
Fischer, A.R.H., Frewer, L.J., 2009. Consumer familiarity with foods and the perception of risks and benefits. Food Qual. Prefer. 20, 576–585.
Fischer, A.R.H., De Vries, P.W., 2008. Everyday behaviour and everyday risk: an exploration how people respond to frequently encountered risks. Health Risk Soc. 10, 324–389.
Fishburn, P.C., 1988. Normative theories of decision making under risk and uncertainty. In: Bell et al. (Eds.), Decision Making. Descriptive, Normative and Prescriptive Interactions. Cambridge University Press, Cambridge, pp. 78– 98.
Fransisco, E.M., Anderson, J.R., 1972. Change and choice west of the darling. Aust. J. Agric. Econ. 16, 82–93.
Gaskell, G., Alum, N., Wagner, W., Kornberger, N., Torgensern, H., Hampel, J., Barbes, J., 2004. GM foods and the misperception or risk perception. Risk Anal. 24, 185– 194.
Gonzalez, R., Wu, G., 1999. On the shape of the probability weighting function. Cogn. Psychol. 42, 1676–1690.
Goodwin, B.K., Schroeder, T.C., 1994. Human capital, producer education programs, and the adoption of forward pricing methods. Am. J. Agric. Econ. 76, 936–947.
Green, P., Srinivasan, V., 1978. Conjoint analysis in consumer research: issues and outlook. J. Cons. Res. 5, 103–123.
Griffin, R.J., Dunwoody, S., Neuwirth, K., 1999. Proposed model of the relationship of risk information seeking and processing to the development of preventive behaviors. Environ. Res. A 80, 5230–5245.
Grimes, G., Meyers, S., 2001. Hog marketing contract study. Working paper No. AEWP 2006-01, Dept. of Agricultural Economics, University of Missouri. Available from: <http://agebb.missouri.edu/mkt/vertstud09.pdf>.
Hamal, K.B., Anderson, J.R., 1982. A note on decreasing absolute risk aversion among farmers in Nepal’’. Aust. J. Agric. Econ. 26, 220–225.
Hardaker, J.B., Huirne, R.B.M., Anderson, J.R., Lien, G., 2004. Coping with Risk in Agriculture, second ed. Oxford University Press.
Hicks, J., 1962. Liquidity. Econ. J. 72, 787–802.
Hildreth, C., Knowles, G.J., 1986. Farmers utility functions. In: Goel, P.K., Zelner, A. (Eds.), Bayesian Inference and Decision Techniques. Essays in honour of Bruno de Finetti, North Holland, Amsterdam, pp. 291–317.
Hirschleifer, D., 2002. Investor psychology and asset pricing model. J. Finance 56, 1533–1597.
Hoffmann, A.O.I., 2007. Essays on the Social Dimensions of Investor Behaviour. PhD Dissertation, Faculty of Economics and Business. University of Groningen, Groningen, The Netherlands.
Holbrook, M.B., Hirschman, E.C., 1982. The experiential aspects of consumption: consumer fantasies, feelings and fun. J. Cons. Res. 18, 39–50.
Hui, S.K., Fader, P.S., Bradlow, E.T., 2009. Path data in marketing: an integrative framework and prospectus for model building’’. Market. Sci. 28, 320–335.
Huijsman, A., 1986. Choice and Uncertainty in a Semisubsistence Economy. A Study of Decision Making in a Philippine Village. PhD dissertation, Wageningen University, The Netherlands.
Hull, J., Moore, P.G., Thomas, H., 1973. Utility and its measurement. J. R. Stat. Soc. A Stat. 136, 226–247.
Isik, M., Khanna, M., 2003. Stochastic technology, risk preferences, and adoption of site specific technologies. Am. J. Agric. Econ. 85, 305–317.
Jacoby, J., Olson, J.C., Haddock, R.A., 1971. Price, brand name, and product composition characteristics as determinants of perceived quality. J. Appl. Psychol. 55, 570–579.
Jaworski, B.J., Kohli, A.K., 1993. Market orientation: antecedents and consequences. J. Market. 57, 53–70.
Jia, J., Dyer, J.S., 1996. A standard measure of risk and risk-value models. Manage. Sci. 45, 519–532.
Jia, J., Syear, J., Butler, C., 1999. Measures of perceived risk. Manage. Sci. 45, 519– 532.
Jun, W.-J., Jolibert, A., 1983. Revealed versus hidden attributes as determinants of perceived product quality. J. Econ. Psychol. 4, 263–272.
Just, E.R., Pope, R.D. (Eds.), 2002. A Comprehensive Assessment of the Role of Risk in US Agriculture. Kluwer Academic Publishers.
Just, R.E., Pope, R.D., 1978. Stochastic specification of production functions and economic implications. J. Econ. 7, 67–86.
Kalogeras, N., 2010. Essays on Individual Decision-Making: With Special References to Agribusiness & Food Markets. PhD dissertation, Marketing-Finance Research Lab, School of Economics and Business, Maastricht University, The Netherlands.
Kalogeras, N., Valchovska, S., Baourakis, G., Kalaitzis, P., 2009. Dutch consumers’ willingness to pay for organic olive-oil. J. Int. Food Agric. Market. 21, 286–311.
Keeney, R.L., Raiffa, H., 1976. Decisions with Multiple Objectives: Preferences and Values Tradeoffs. Willey, New York.
King, P.R., Boehlje, M., Cook, M.E., Sonka, S.T., 2010. Agribusiness economics and management. Am. J. Agric. Econ. 92, 554–570.
Kirmani, A., Rao, A.R., 2000. No pain, no gain: a critical review of the literature on signalling unobservable product quality. J. Market. 64, 66–79.
Knight, F.H., 1933. Risk, Uncertainty and Profit. Houghton Mifflin, Boston, MA.
Kunreuther, H.C., Ginsberg, R., 1978. Disaster Insurance Protection: Public Policy Lessons. Wiley, New York.
LaValle, I.H., 1978. Fundamentals of Decision Analysis. Holt, Rinehart, and Winston Publisher, New York.
Levin, J., 1965. Three model factor analysis. Pyschol. Bull. 64, 442–452.
Levy, H., 1992. Stochastic dominance and expected utility: survey and analysis. Manage. Sci. 38, 555–583.
Levy, H., Markowitz, H., 1979. Approximating expected utility by a function of mean and variance. Am. Econ. Rev. 69, 308–317.
Lin, W., Dean, W., Moore, C.V., 1974. An empirical test of utility versus profit maximization in agricultural economics. Am. J. Agric. Econ. 56, 497–508.
Lindner, R., Gibbs, M., 1990. A test of bayesian learning from farmer trials of new wheat varieties. Aust. J. Agric. Econ. 34, 21–38.
Luce, R.D., 1980. Several possible measures of risk. Theor. Decis. 12, 217–228 (Correction 1981, 13, 381).
MacCrimmon, K.R., Wehrung, D.A., 1986. Taking Risks: The Management of Uncertainty. The Free Press, New York.
MacCrimmon, K.R., Wehrung, D.A., 1990. Characteristics of risk taking executives. Manage. Sci. 36, 422–435.
MacCrimmon, K.R., Stanbury, W.T., Wehrung, D.A., 1980. Real money lotteries: a study of ideal risk, context effects, and simple processes. In: Wallsten, T.S. (Ed.), Cognitive Processes in Choice and Decision Behaviour. Lawrence Erlbaum, New Jersey, pp. 155–177.
Markowitz, H., 1952. Portfolio selection. J. Finance 7, 77–91.
Martin, L.J., Hope, D., 1984. Risk and returns form alternative marketing strategies for corn producers. J. Futures Markets 4, 513–530.
Meade, N., Islam, T., 1995. Forecasting with growth curves: an empirical comparison. Int. J. Forecasting 11, 199–215.
Mela, D.J., 2001. Why do we like what we like? J. Sci. Food Agric. 81, 10–16.
Meulenberg, M.T.G., 2000. Voluntary marketing institutions in food marketing systems. In: van Tilburg, A., Moll, H.A.J., Kuyvenhoven, A. (Eds.), Agricultural Markets Beyond Liberalization. Kluwer Academic Publishers, Dordrecht, The Netherlands, pp. 213–233.
Meyer, J., 2002. Expected utility as a paradigm for decision making in agriculture. In: Just, E.R., Pope, R.D. (Eds.), A Comprehensive Assessment of the Role of Risk in US Agriculture. Kluwer Academic Publishers.
Michaut, A.M.K., 2004. Consumer acceptance of new products. PhD dissertation, Marketing and Consumer Behaviour Group, Dept. of Social Sciences, Wageningen University, Wageningen, the Netherlands.
Millar, M.G., Tesser, A., 1986. Effects of affective and cognitive focus on the attitude– behaviour relationship. J. Pers. Appl. Psychol. 51, 270–276.
Miller, D., Kets de Vries, M.F.R., Toulouse, J., 1982. Top executive locus of control and its relationship to strategy-making, structure, and environment. Acad. Manage. J. 25, 237–253.
Monroe, K.B., Krishnan, R., 1985. The effects of price and subjective product evaluations. In: Jacoby, J., Olson, J. (Eds.), Perceived Quality. Lexinghton Books, Lexinghton, MA, pp. 209–232.
Moolgavkar, S.H., 2006. Fine particles and mortality. Inhal. Toxicol. 18, 93–94.
Moorman, C., Diehl, K., Brinberg, D., Kidwell, B., 2004. Subjective knowledge, search location, and consumer choice. J. Cons. Res. 31, 673–680.
Moscardi, E., de Janvry, D., 1977. Attitudes toward risk among peasants: an econometric approach. Am. J. Agric. Econ. 59, 710–716.
Namakura, Y., 1996. Sumex utility functions. Math. Soc. Sci. 31, 39–47. von Neumann, J., Morgenstern, O., 1947. Theory of Games and Economic Behaviour, second ed. Princeton University Press, Princeton.
Northen, J.R., 2000. Quality attributes and quality cues: effective communication in the meat supply chain. Brit. Food J. 102, 230–245.
Nunnally, J.C., Bernstein, I.H., 1994. Psychometric Theory, third ed. McGraw-Hill, New York.
Officer, R.R., Halter, A.N., 1968. Utility analysis in a practical setting. Am. J. Agric. Econ. 50, 257–277.
Ophuis, P.A., van Trijp, H., 1995. Perceived quality: A market-driven and consumer oriented approach. Food Qual. Prefer. 6, 177–183.
Payne, J.W., Bettman, J.R., Johnson, E.J., 1993. The Adaptive Decision-Maker. Cambridge University Press, Cambridge.
Payne, J.W., Laughhann, D.J., Crum, R.L., 1980. Translations of gambles and aspiration effects in risky choice behaviour. Manage. Sci. 26, 1039–1060.
Pennings, J.M.E., Smidts, A., 2000. Assessing the construct validity of risk attitude. Manage. Sci. 46, 1337–1348.
Pennings, J.M.E., Wansink, B., 2004. Channel contract behaviour: the role of risk attitudes, risk perceptions, and channel members’ market structures. J. Bus. 77, 697–723.
Pennings, J.M.E., Kleinmuntz, D.N., 2005. Validating risk-value model risk preference measures: an experimental study of portfolio managers. Working Paper, Dept. of Agricultural and Consumer Economics, University of Illinois at Urbana-Champaign.
Pennings, J.M.E., Meulenberg, M.T.G., 1997. Hedging efficiency: a futures exchange management approach. J. Futures Markets 17, 599–615.
Pennings, J.M.E., Garcia, P., 2001. Measuring producers’ risk preferences: a global risk-attitude construct. Am. J. Agric. Econ. 83, 993–1009.
Pennings, J.M.E., Leuthold, R.M., 2000. The role of farmer’s behavioural attitudes and heterogeneity in futures contracts usage. Am. J. Agric. Econ. 82, 908–919.
Pennings, J.M.E., Wansink, B., Meulenberg, M.T.G., 2002. A note on modelling consumer reactions to a crisis: the case of the mad cow disease. Int. J. Res. Mark. 19, 91–100.
Pennings, J.M.E., Smidts, A., 2003. The shape of utility functions and organizational behaviour. Manage. Sci. 11, 199–215.
Pennings, J.M.E., Garcia, P., 2005. Predicting strategic decisions: what can utility functions tell us? Working paper Marketing & Decision Sciences Group, University of Illinois at Urbana-Champaign, IL, US.
Pratt, J.W., 1964. Risk aversion in the small and in the large. Econometrica 32, 122– 136.
Putten, M.C. van, Frewer, L.J., Gilissen, L.J.W.J., Gremmen, B., Peijnenburg, A.A.C.M., Wichers, H.J., 2006. Novel foods and food allergies: a review of the issues. Trends Food Sci. Tech. 17, 289–299.
Roe, B., Sporleder, T.L., Belleville, B., 2004. Hog producer preferences for marketing contract attributes. Am. J. Agric. Econ. 86, 115–123.
Roosen, J., Henessy, D.A., 2003. Tests for the role of risk aversion on input use. Am. J. Agric. Econ. 85, 30–43.
Ropkins, K., Beck, A.J., 2000. HACCP in the home: A framework for improving awareness of hygiene and safe food handling with respect to chemical risk. Trends Food Sci. Tech. 11, 105–114.
Ross, S.A., Westerfield, R.W., Jaffe, J., 2005. Corporate Finance, fifth ed. McGraw-Hill International Edition, Singapore.
Saha, A., 1993. Expo-power utility: A flexible form for absolute and relative risk aversion. Am. J. Agric. Econ. 75, 905–913.
Sarin, R.K., Weber, M., 1993. Risk-value models. Eur. J. Oper. Res. 70, 135–149.
Sarin, R.K., 1987. Some extensions of Luce’s measures of risk. Theor. Decis. 22, 25– 41.
Schoemaker, P.J.H., 1982. The expected utility model: its variants, purposes, evidence and limitations. J. Econ. Liter. 20, 529–563.
Schroeder, T.C., Tonsor, G.T., Pennings, J.M.E., Mintert, J., 2008. Consumer food safety risk perceptions and attitudes: impacts on beef consumption across countries. B.E. J. Econ. Anal. Pol. 7(1) (contributions), Article 65. Available from: <http:// www.bepress.com/bejeap/vol7/iss1/art65>.
Schurr, P.H., 1987. Effects of gain and loss frame on risky purchase negotiations. J. Appl. Psychol. 72, 351–358.
Scott, J.T., Baker, C.B., 1972. A practical way to select an optimum farm plan under risk. Am. J. Agric. Econ. 54, 657–660.
Shapira, Z., 1995. Risk Taking: A Managerial Perspective. Russell Sage, New York.
Siergist, M., 2000. The influence of trust and perceptions of risks and benefits on the acceptance of gene technology. Risk Anal. 20, 195–204.
Smidts, A., 1990. Decision Making Under Risk. Ph.D. dissertation, Wageningen University, Wageningen, The Netherlands.
Smidts, A., 1997. The relationship between risk and strength of preference: a test of intrinsic risk attitude. Manage. Sci. 43, 357–370.
Srinivasan, N., Ratchford, B.T., 1991. An empirical test of a model of extended search of automobiles. J. Cons. Res. 18, 233–242.
Steenkamp, J.-B.E.M., 1989. Product Quality. van Gorcum, Assen, The Netherlands.
Steenkamp, J.-M.E.M., 1990. Conceptual model of the quality perception process. J. Bus. Res. 21, 309–333.
Thornton, P.K., 1985. Treatment of risk in a crop protection information system. J. Agric. Econ. 36, 201–211.
Tsiang, S.C., 1972. The rationale of the mean-standard deviation analysis, skewness preference and demand of money. Am. Econ. Rev. 64, 354–371.
Tversky, A., 1967. Additivity, utility, and subjective probability. J. Math. Psychol. 4, 175–202.
Van Heerde, H.J., Helsen, K., Dekimpe, M.G., 2007. The impact of product-harm crisis on marketing effectiveness. Market. Sci. 26, 230–245.
Van Ittersum, K., Candel, M.J.J.M., Meulenberg, M.T.G., 2003. The influence of the image of a product’s region of origin on product evaluation. J. Bus. Res. 56, 215– 226.
Voss, K.E., Spangenberg, E.R., Grohmann, B., 2003. Measuring the hedonic and utilitarian dimensions of consumer attitude. J. Market. Res. 40, 310–320.
Wakker, P.P., Denefee, D., 1996. Eliciting von Neumann–Morgenstern utilities when probabilities are distorted or unknown. Manage. Sci. 42, 1131–1150.
Wang, H., Barney, B.J., Reuer, J.J., 2003. Stimulating firm-specific investment through risk management. Long Range Plan. 36, 49–59.
Wansink, B., 2004. Consumer reactions to food safety crises. Adv. Food Nutr. Res. 48, 103–150.
Wansink, B., Van Ittersum, K., 2007. Portion size me: downsizing our consumption norms. J. Am. Diet. Assoc. 107, 1103–1106.
Wansink, B., 2007. Why We Eat More Than We Think: Mindless Eating. Bantam Dell, New York.
Weber, E.U., Milliman, R.A., 1997. Perceived risk attitudes: relating risk perception to risky choice. Manage. Sci. 43, 123–144.
Weber, E.U., Hsee, C., 1998. Cross-cultural differences in risk perception, but crosscultural similarities in attitudes toward perceived risk. Manage. Sci. 44, 1205– 1217.
Webster, J., Kennedy, J., 1975. Measuring farmer’s trade-offs between income and focus loss income. Am. J. Agric. Econ. 57, 97–105.
Wind, Y.J., 1982. Product Policy: Concepts, Methods, and Strategy. Addison-Welsey, Reading.
Wossink, A., Denaux, Z.S., 2006. Environmental and cost efficiency of pesticide use in transgenic and conventional cotton production. Agric. Syst. 90, 312–328.
Zeuli, K.A., 1999. New risk management strategies for agricultural cooperatives. Am. J. Agric. Econ. 81, 1234–1239.
Zylbersztajn, D., Omta, O., 2009. Advances in Supply Chain Analysis in Agro-Food Systems. Editora Singular, Sao-Paolo.
