Introduction to risk modelling and decision analysis (course in Univ Kuopio)
This page is a lecture.
The page identifier is Op_en1503 |
|---|
| Moderator:Jouni (see all) |
|
|
| Upload data
|
This page contains the open material for the course Introduction to risk modelling and decision analysis, a course held in the University of Kuopio, 18.-22.9.2006.
Contents
Schedule of the course
Mon 18 September, 2006 Medistudia, Room MHS1
- 9:15-10:00 Introduction to course and distribution of homework Jouni
- 10:15-11:00 Perspective on risk (definition of risk measures, system boundaries) pp. 1-24, oma riskimääritelmä Jouni
- 11:15-12:00 History of risk research (Red book approach, Nuclear safety) Olli
Tue 19 September, 2006 Medistudia, Room MHS1
- 9:15-10:00 Risk management pp. 147-189 Jouni
- 10:15-11:00 Exposure assessment pp. 68-80 Olli
- 11:15-12:00 Dose-response assessment, Risk assessment tools (NOAEL, benchmark, CSF, RfD) pp. 46-68, animal-human extrapolation Olli
Wed 20 September, 2006 Medistudia, Room MR10
- 9:15-10:00 Probability theory [frequentist and subjective (Bayesian) approach] Marja-Leenalla sopivia kirjoja? Uncertainty 220-230. Jouni
- 10:15-11:00 Monte Carlo simulation and other tools (uncertainty pp. 81-98) Analytica Olli
- 11:15-12:00 Decision theory (utility, decision tree, utilitarian, egalitarian and other decision rules) [1]
Markolla Introduction to decision theory? Jouni
Thu 21 September, 2006 Medistudia, Room MHS1
- 9:15-10:00 Graphical representations of risk (DAG, impact pathway, event tree, mind map, pyrkilo, flow chart) Mikan Intarese-paperi, Analytica, pp. 38-46, D1 Beneris Jouni
- 10:15-11:00 Perception of risks (trust, attributes of risk, expert vs. layman perception) pp. 99-134 Olli
- 11:15-12:00 Models in risk assessment (pharmacokinetic Jouni, atmospheric) pp. 68-75, Portierin luennot http://ytoswww/yhteiset/Huippuyksikko/Kirjallisuus/Portier_AdvMetERA_20051011/, Johnin luennot Harvard, Kopran esittely (Marko)
Fri 22 September, 2006 Canthia, Room MC3
- 9:15-12:00 Computer work in a computer classroom. Finishing and presenting homework. Using Wiki and Pyrkilo.
Homework
Look at the new page about the risk assessment
Task:
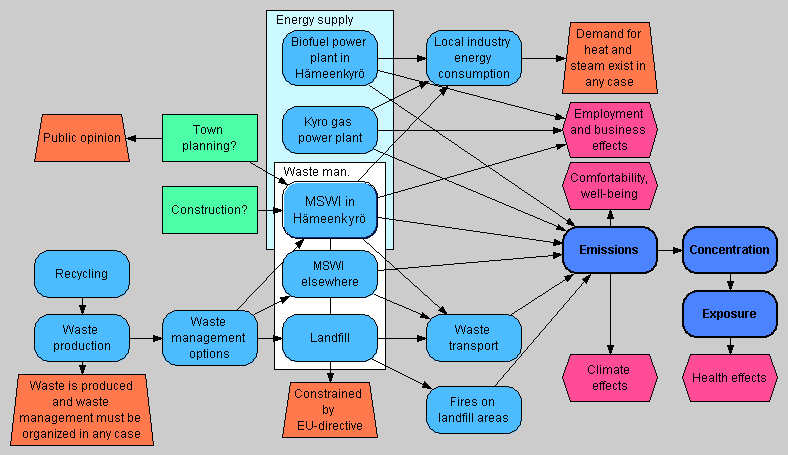
- To create, define, and describe variables related to Hämeenkyrö case (both general and case-specific)
- To make them match with the other variables (dimensions, units, interpretation)
- To defend the choices in an open argumentation and summarise the resolutions
- To comment and argue the choices of other students
Perspectives on risk
- Hazard, endanger, exposure to mischange or peril. (Oxford English Dictionary)
- The chance of hazard or commercial loss. (Oxford English Dictionary)
- As in Risk-Money, an allowance paid to a cashier to cover accidental deficits. (Oxford English Dictionary)
- Risk = Probability ⊗ Severity (Wilson and Crouch)
- Risk = S{Probability ⊗ Severity ⊗ Weight} (Wilson and Crouch)
- ⇤--1: . However, sometimes risks are not truly multiplicative. (Tversky et al., 1990) (type: truth; paradigms: science: attack)
- Risk: a characteristic of a situation or action wherein two or more outcomes are possible, the particular outcome that will occur is unknown, and at least one of the possibilities is undesired. (Covello and Merkhofer, 1993)
- Risk is such a property of a situation that tells that it is uncertain which of the possible outcomes will occur, at least one of them is unfavourable, and that there is a need to improve the expectation of the outcome. (Tuomisto, 2006)
Development of risk management
Table I. Developmental Stages in Risk Management (Ontogeny Recapitulates Phylogeny)
- All we have to do is get the numbers right
- All we have to do is tell them the numbers
- All we have to do is explain what we mean by the numbers
- All we have to do is show them that they’ve accepted similar risks
- All we have to do is show them that it’s a good deal for them
- All we have to do is treat them nice
- All we have to do is make them partners
- All of the above
(Fischhoff, Risk Analysis 1995:15:137)
What is risk assessment?
Traditional view
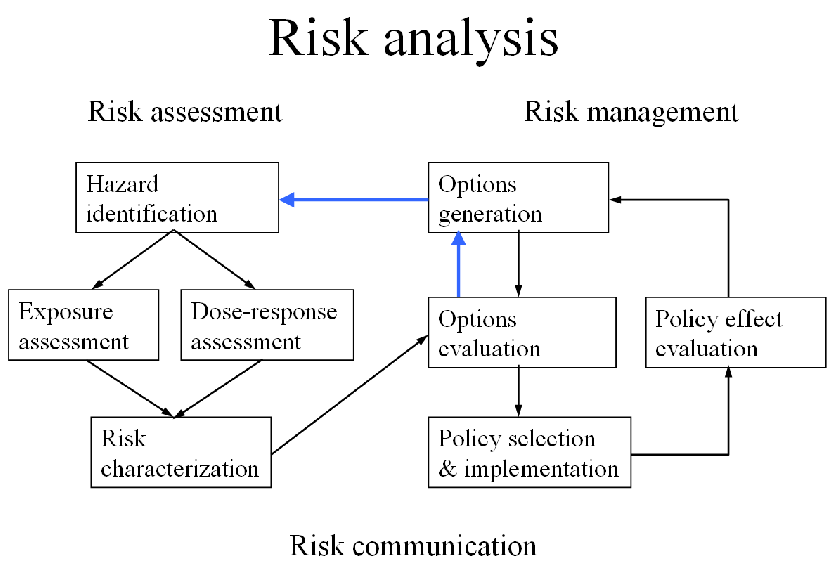
A scientific enterprize consisting of four phases:
- Hazard identification
- Exposure assessment
- Dose-response assessment
- Risk characterization
⇤--1: . But these phases do not capture the issues raised by Fischhoff. Therefore, something better should developed. Jouni (type: truth; paradigms: science: attack)
Suggestion for a new view on risk assessment
Risk assessment research should answer the following two questions:
- What are the rules that enable an open (non-organised, non-fixed) group of rational actors to describe environmental health risks and resolve disputes that arise during the process about the content?
- When should I, as a rational critic who judges reasonably, regard a risk assessment as acceptable? (modified from van Eemeren and Grootendorst, 2004)
Measures of risk
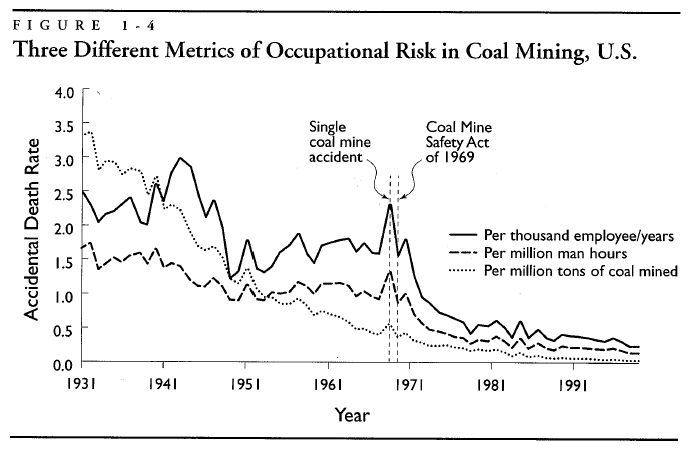
Possible outcome measures (indicators)
- Deaths...
- by age
- by cause
- Injuries...
- by cause
- by type
- by some sort of severity index
- ...per
- year
- lifetime
- unit operation
- event
- ton
- unit output
- Loss of life expectancy
- Working days lost
- Public days lost
- Quality adjusted life years (QALY)
- Disability adjusted life years (DALY)
- Ecological and other indicators
Defining system boudaries is a critical thing.
The probability of causation (POC)
POC = P(risk from the cause of interest)/P(risk due to all causes)
What is the POC for PM2.5 causing cardiovasular deaths in the EU?
What is the POC for vinylchloride causing angiosarcoma in liver?
Graphical representations of risk
- Directed acyclic graphs (DAG)
- impact pathway
- event tree
- mind map
- pyrkilo
- flow chart
Perception of risks
(trust, attributes of risk, expert vs. layman perception) pp. 99-134 Olli
The way people perceive risks, depends critically upon the way question is framed or posed.
Example: Class of psychology at Stanford University were asked set of carefully worded questions. Tversky and collaborators conducted thisstudy in the 80s.
Assuming U.S. is preparing for an outbreak of a disease imported from Asia two alternative programs, A and B, have been suggested. If program A is adopted 200 people would be saved. If program B is adopted there is 1 in 3 chance that 600 will be saved and 2/3 chance that no one will be saved.
72% of psychology students chose A and 28% chose B. (Why?)
-- definite result vs. risky prospect -- students were risk averse
Same question as above was asked, but with alternative programs C and D.
If program C is adopted 400 people will die.
If program D is adopted, there is a 1/3 probability that no one will die and 2/3 probability that 600 would die.
78% of the students chose program D. (Why?)
-- choice being expressed as people dying (choice between losses) -- now students were risk takers
ATTRIBUTES OF RISK
Representativeness
-- Often small samples may erroneously be viewed as reliable (e.g. a particular automobile is considered as representative ot the manufacturer´s entire line)
Anchoring
-- First judgement that occurs is progressively adjusted for subsequent occurances. (e.g. Boeing 747 aircraft collided on the shortly after their introduction into service -> regarded as risky airplanes
Availability
-- Another cognitive factor resulting in mis-estimates of risk. It arises from the ease of recollection of events; "If I can conceive of a number of ways for something to fail, the probability of failure must be high."
Voluntariness
-- e.g. natural hazards are usually considered to be voluntary and therefore more acceptable
Availability of alternatives
-- If a choice is available, acceptance may become easier even if choosing person or public picks an alternative with higher calculated risk (e.g. many people choose automobile travel over airplane travel)
Necessity
-- If you feel you definetly need something with a small risk, you are ready to face the risk (e.g. Need to dye hair)
Immediacy
-- Immediate risk is perceived as worse than if it is delayed
Dread
-- Dread for cancer, many other lingering diseases are often dreaded less.
Rare yet catastrophic
-- Many people are more concerned about risks that are catastrophic (with many fatalities) than those which involve fewer fatalities but are more frequent, even when the average risk is the same
Knowledge about risk
-- How well do persons exposed to risks understand the risk, its probability, consequences and uncertainties. This personal lack of knowledge may cause even a small risk to become unacceptable.
Familiarity
-- Old and familiar risks, such as automobile accidents, are acceöted more readily than new and strange ones.
Distribution of risk
-- Is the risk situation widespread; does it affect average persons of especially sensitive persons
Potential for misuse or abuse
-- If there is a chance of tehcnology being misused, there is often a perception that the risk is high even when properly used.
Trust
-- Trust is created slowly, but can be destroyed quickly.
EXAMPLES OF RISK PERCEPTION
It is useful to compare the risk calculation with other risks with which the reader may be more familiar from everyday life. (Wilson & Crouch p. 110)
It can be seen quite clearly that different kings of fatalities are underestimated and overestimated. (Wilson & Crouch p. 111)
Nuclear power is perceived very differently among experts and others. (Wilson & Crouch p. 112) Reveals risk, which are overestimated by their dread (Slovic 1987)
It is strange that cancer risk due to Radon exposure, which can be mitigated with realtively low-cost measures, has been largely ignored, particularly when contrasted with the many other smaller risks that have been addressed. (Wilson & Crouch p. 115)
Taulukko. Luulot ja tilastot ristiriidassa (Tieteen kuvalehti 13/2004)
Comparison of risks for different activities that provide the same benefit. Example comparison for electricity generation
Shows monetary damage per kWh of electricity generation. (Wilson & Crouch p. 123)
WHAT IS THE MAGNITUDE OF RISK WHICH IS ACCETABLE?
Risk (=here pain) perception of Charlie Brown from the cartoon "Peanuts"
" That´s how I judge pain Lucille... Will it hurt more than a punch in the nose or less than a punch in the nose"
EXAMPLE: EXPRESSION OF RISK TO PEOPLE EXPOSED TO CHORNOBYL DISASTER
-- Russian estimate 24000 persons between 3-15 km from the plant received 330000 person-rems total integrated dose, or about 14 rems average dose.
-- Even if we assume a linear dose response relationship, with 3000 person-rems per cancer, the risk may be expressed in different ways. Calculation (330000/3000) gives us 110 cancers expected in the lifetime ot that population. (31 people within the power plant itself died of acute radiation sickness combined with burns, within 60 days of the accident).
-- Dividing the 110 by the approximately 5000 cancer deaths expocted in this small group from other causes, the accident caused "only" a 2% increase in cancer. (compare this with 30% of risk of cancer or heart disease caused by smoking)
-- If we consider the 75 million people in Belarus and the Ukraine who received, and will receive, 28 million person-rems over their lifetimes. On the linear dose response relationship this leads to 9000 "extra cancers" - surely a large number for one accident. But dividing by the 15 000 000 cancers expected in the whole Ukrainian population leads to an increase of only 0.0062 which might be considered insignificant in some contexts.
PERCEPTION OF HISTORICAL AND NEW RISKS
Wilson pp 26-
We can classify risks as "Historical Risks" and "New Risks"
Historical risks include: -- infectitious diseases -- motor vehicles -- industrial agents ...
The historical data merely tell us what the risk was last year, and the model might be that next year will be like last year.
Historical risks usually arise from events of comparatively high probability, so that an appreciable numger of events occur annually in the population at risk, but each event ahs a comparatively low consequence (less than avout 10 deaths per event).
New risks:
Range of catasrophic but improbable events:
-- large meteor impacts -- dam breaks -- reactor meltdowns ...
New risks eventually become historical ones. In the opening of the first passenger railroad (Liverpool-Manchester) thee was a fatal accident. The number of accidents per passenger mile in railroad travel pas dropped by a factor of nearly 100 since 1830. And the former new risk has transformed to a historical one.
COMMON PUBLIC MISCONCEPTIONS
Cancer clusters There are clusters of infectious disease (e.g. legionnaire´s disease), and occupational clusters of non-infectious disease, but very few purely environmental clusters of non-infectious diseases, such as cancer caused by environmental agents. Looking for clusters is clearly in the public mind. The clusters that have been claimed to exist are usually due to chance or to some common lifestyle factor.
Caused by environment
WHO and many distinguished scientists considered 1964 that "90% of cancers are environmentally caused". This does NOT mena same as "90% of all cancers are caused by environmental pollution"! Environment includes substances and agents naturally present in foods, sunlight, smoking, alcoholic beverages, and chemicals or radiations to which people are exposed during their daily lives. There is little or no increase in cancers known to be caused by chemical polliton.
Smoking and diet are the two most important factors (Wilson & Crouch p. 129)
Radiation hazards
Several misconceptions about radiation (e.g. long latency for cancer). Radiation doses are often the easiest of environmental exposures to determine, and the consequences are probably the best understood of all exposures. Both accident probabilities and accident consequences due to nuclear power are often estimated 1000-fold higher than by professionals.
In Utah, Atomic Bomb test and cancer within a few years of the test. Long latency time for cancer due to radiation.
A perception that nuclear power production might be a contributor to the risk of nuclear war might be a principal cause of the adverse reactions to nuclear electric power. This involves all three effects of anchoring, availability and dread.
Monte Carlo simulation and other tools
(uncertainty pp. 81-98) Analytica Olli Chapter 5 Covello & Merkhafer pp (203-235)
Uncertainty usually plays a big role in risk assessment. We are not interested in a single point estimate, but the probability or distribution as the final result. Summary statistics that collapse estimates into a single number do not provide all of the information that may be nacessary for decision making and risk management.
In most risk assessments, one of two situations exist:
1) the processes associated with the risk are sufficiently well understood that functional relationships among important variables can be presumed but the values of some of the variables are not known.
2) The physics, chemistry, biology, or other science and engineering aspects or the risk are so poorly understood that the functional relationships among important variables cannot be presumed to be known.
BRIEF OVERVIEW FOR SOME COMMONLY USED METHODS
Classical versus Bayesian methods for quantifying uncertainties.
The objective perspective sees risk as a measurable property of the physical world. A risk with a strong objective perspective will adopt methods based on the classical theory of probability and statistics.
-- rely on empirical data and empirical validated models and will draw conclusions based on statistical inference
The subjective perspective regards risk as a product of perceptions. A risk assessment with a strongly subjective perspective will adopt the view of Bayesian way of thinking.
-- the Bayesian or judgemental view holds that probablity is a number expressing a state of knowledge or degree of belief that depends on the information, experience, and theories of the individual who assigns it. Different people may assign different probabilities and the probability assigned by any one person may change over time as new information is acquired.
Bayesians regard the models and assumptions inherent in the classical approach (e.g. linear models, normal probability distributions, independence among variables etc.) as arbitrary and not reflecting the best available information for the analysis. They therefore attempt to incorporate all available data, including judgemental data based on experience, to make maximum use of knowledge and expert judgement. Classicalists object that such an approach leaves too much to the idiosyncratic judgements of the analyst and produces analyses that cannot be fully confirmed or validated by others.
Classical models do not reflect uncertainty over possible changes that may have occured since the data were collected and they cannot readily be updated to reflect changing information. Furthermore, the methods are predicated on the assumptions inherent in the underlying statistical models.
Bayesian view allows probability distributions to be assigned to parameters whose values are unknown. Probabilities represent an individual´s belief about the world, not a specific property of the world. Bayesian methods rely heavily on probabilities elicited from experts. Bayesians believe that individuals with the greatest knowledge and familiarity with the situation under study generally hold relevant information for risk assessment, information that is not entirely captured by a classical statistical model fit to empirical data. In practise, applying Bayesian methods need to assemble panel of experts. Members of the expert panel assess probabilities independently. At the end the results will be aggregated.
Monte-Carlo method
Method involves computing the output of the risk model for many sets of combinations of inputs. The combinations of the input values are obtained by random sampling from the distribution assigned to the input variable. The most popular version of stratified sampling is called Latin hypercube sampling. Monte Carlo simulation randomly generates values for uncertain variables over and over to simulate a model.
For each uncertain variable (one that has a range of possible values), you define the possible values with a probability distribution. The type of distribution you select is based on the conditions surrounding that variable. Distribution typically are: uniform, triangular, normal, lognormal...
Strictly speaking, to call something a "Monte Carlo" experiment, all you need to do is use random numbers to examine some problem.
Excercise with Monte-Carlo:
Simple model: We measure a time for a rock to fall distance of 10 m five times, what is average velocity of the rock (v=s/t)?
-- distance measured: normal distribution, range 9.8-10.2 m (median s=10 m)
-- measured time: uniform distribution, range 1.2-1.7 s (median t=1.45 s)
Randon sample is generated here by a six-sided dice:
For input variable t:
Dice number 1=> t=1.2
Dice number 2=> t=1.3
Dice number 3=> t=1.4
Dice number 4=> t=1.5
Dice number 5=> t=1.6
Dice number 6=> t=1.7
For input variable s:
Dice number 1=> s=9,8
Dice number 2=> s=9,9
Dice number 3=> s=9,95
Dice number 4=> s=10.05
Dice number 5=> s=10.1
Dice number 6=> s=10.2
Throwing dice and assigning dice numbers to input variable values five times (so, sample size=5)
> Result = Distribution with five values, we can calculate mean/median, SD, Confidence intervalls, or plot them into a graph. By increasing sample size, distribution of the result graph would look smoother.
Model implemented to Analytica (TM) with samplesize=10000
See model estimation of pi also.M/esitelmat/analyticakoulutus
Probability trees
Probability trees are generalizations of event trees. Whereas event trees typically are composed of events with two possible outcomes (the event does or does not occur), probability trees may represent uncertainties with three or more possible outcomes whose probabilities of occurance are quantified by a descrete probability distribution.
Figure 27 and 28 illustrate probability trees. The example is a Bayesian analysis conducted to explore the value of conducting animal tests of chloromethane, a possibly carcinogenic chemical used by industry in the manufacture of other chemicals. (Covello & Merkhofer p. 221-222)
Simple example (memories from the high school math): 3. A bag contains 1 red, 2 blue and 3 green sweets. Two sweets are removed without replacement. Draw a probability tree showing the possible outcomes. What is the probability of choosing:
(a) two sweets the same colour
(b) two different sweets
Solve the problem (max 5 minutes)


